Made with
ConceptDraw
DIAGRAM 17

Winter Sports.
Olympic Games Infographics. Medal Table

ConceptDraw DIAGRAM is a software for making infographics illustrations. The Spatial Infographics solution together with the Winter Sports solution allows users visually present various geographically distributed sporting information, particularly Winter Olympic Games information.

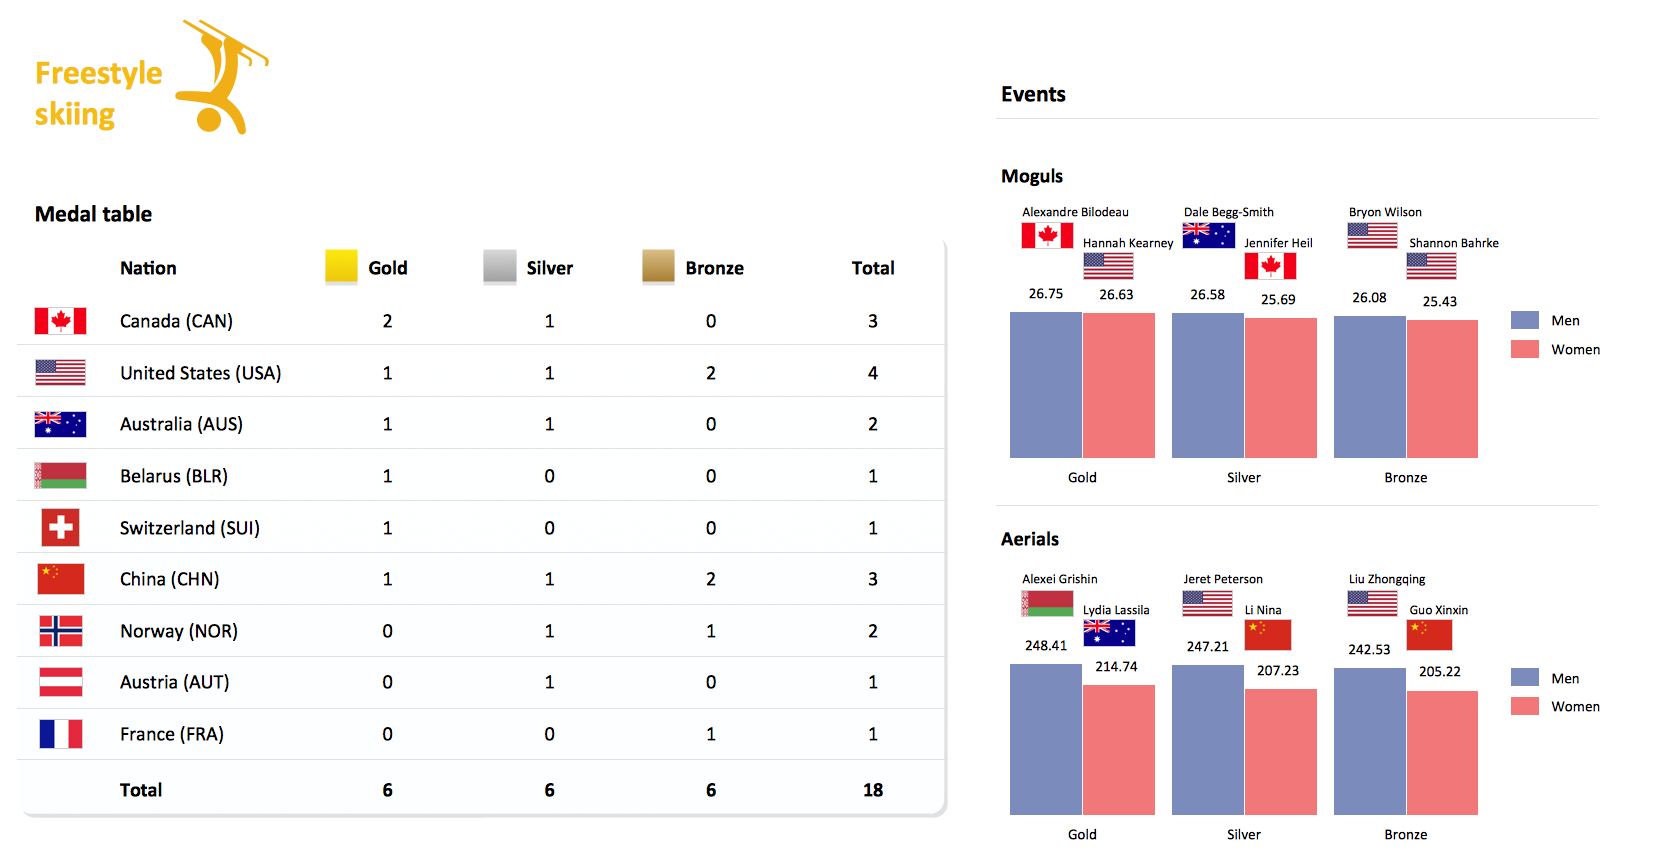
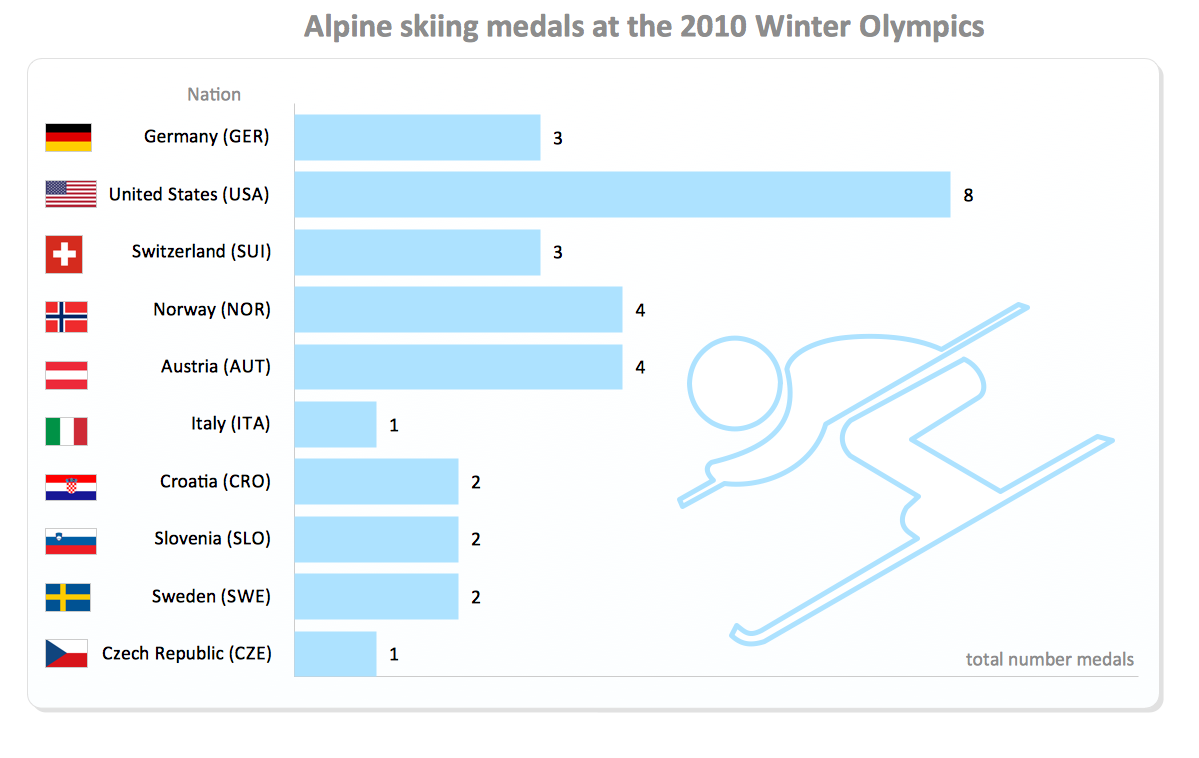
Medal table is the most popular kind of statistics related to Olympic Games. It is easy to produce a regular medal table or put all data to a geographical map to make this table easier to read.

The library objects are scalable vector images that can be easily exported to PDF format, Microsoft PowerPoint, Microsoft Visio, graphic image file, or HTML.

Winter Sports. <br>Olympic Games Infographics. Medal Table *

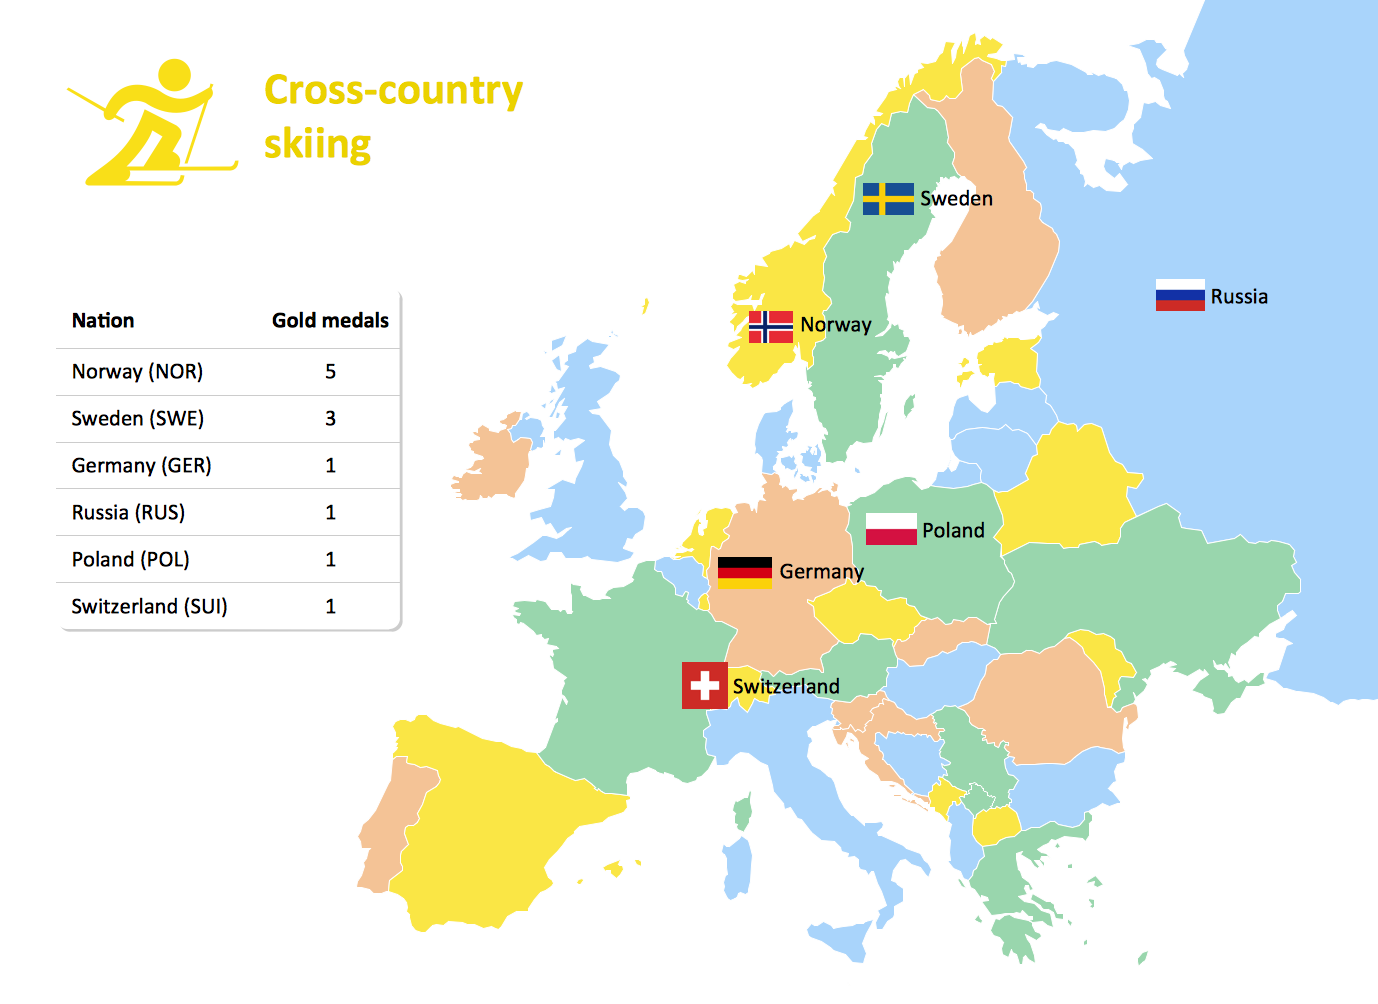
Sample 1.Medal Table - Cross-country Skiing at the 2010 Winter Olympics

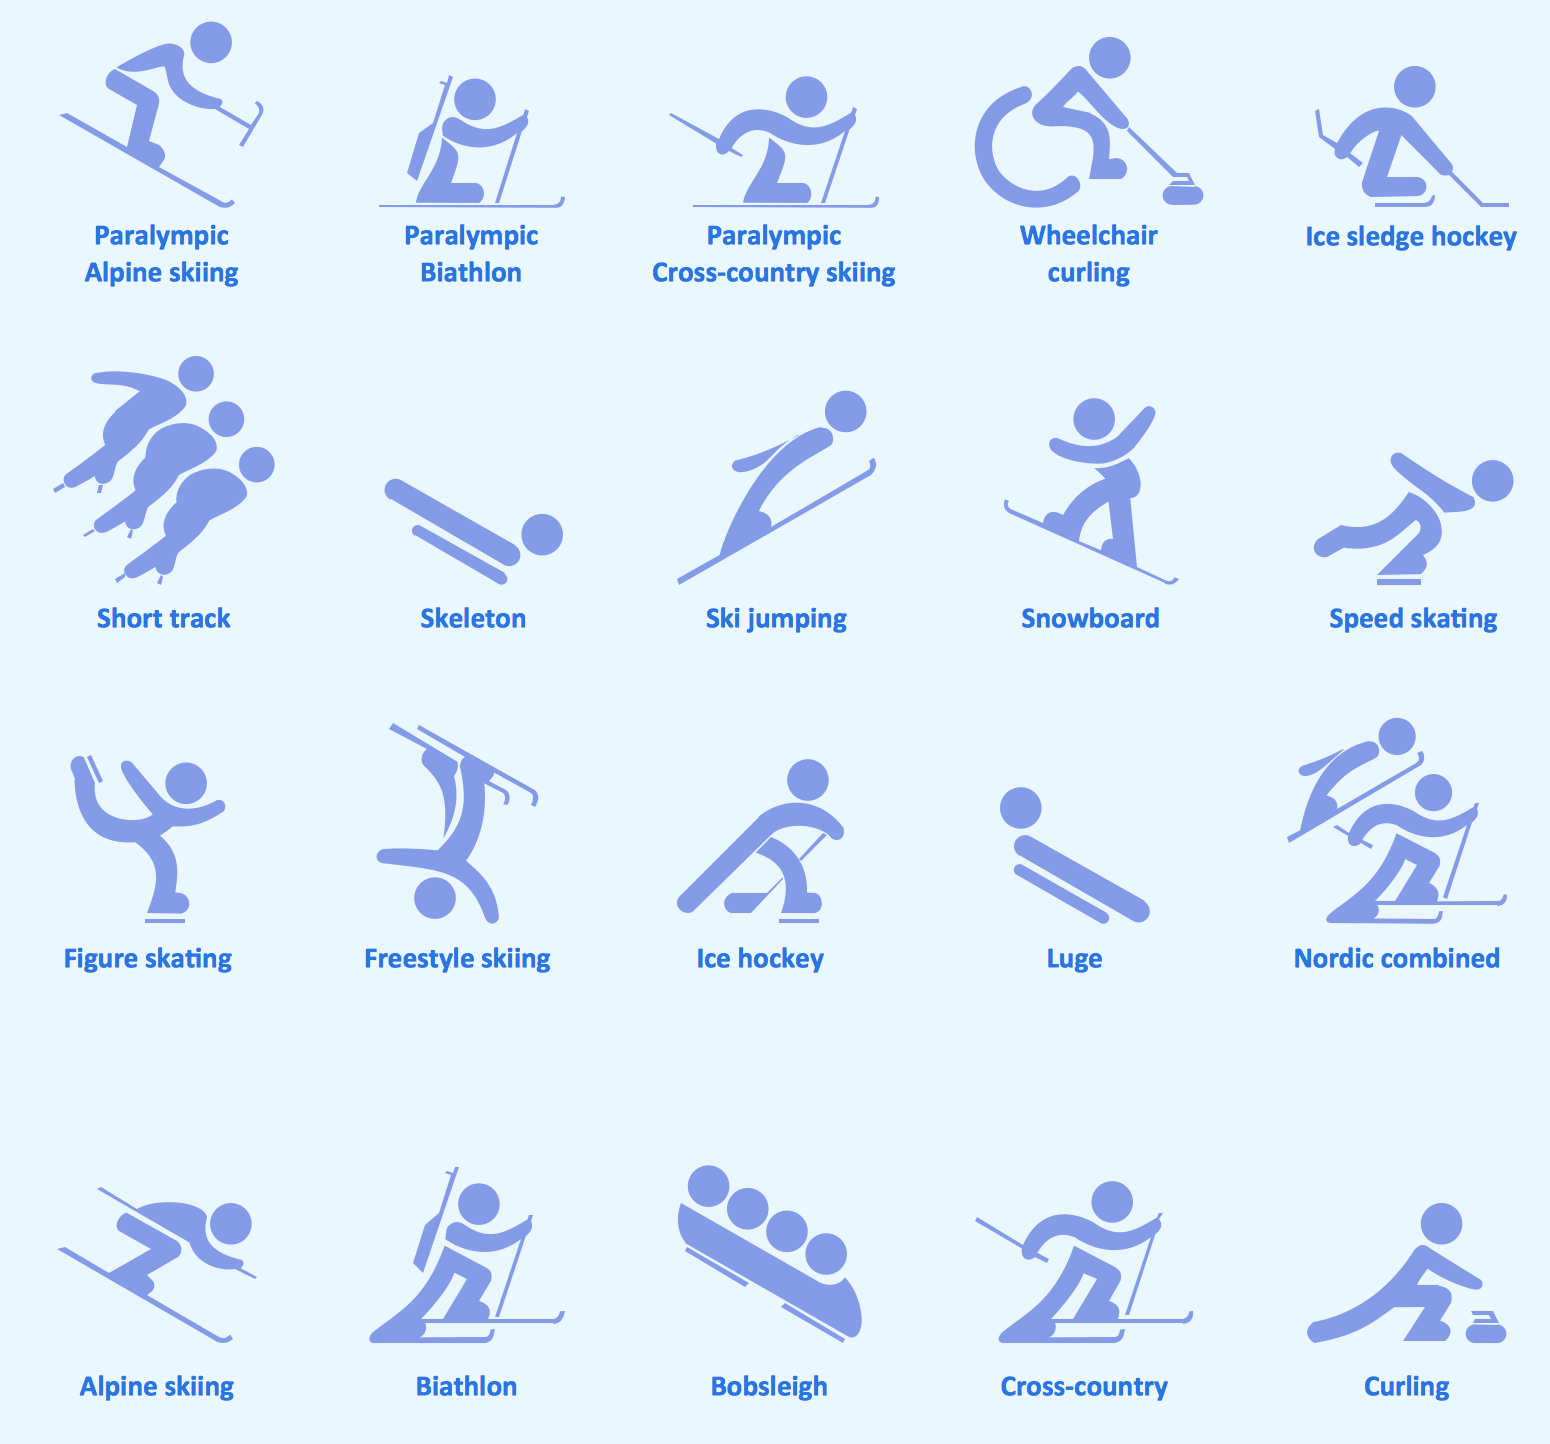
The Winter Sports solution from Sport Area of ConceptDraw Solution Park contains winter sports illustrations and diagram examples, templates, and vector sport pictogram libraries.

This example was created in ConceptDraw DIAGRAM using the 'Winter Sports Symbols' library, from our Winter Sports Solution. An experienced user spent 15 minutes creating this sample.

Keeping your own medal table you are able to get clear view of countries you support or sports you are interested in. This is a good example of illustrated table you may easily modify, print, or publish on web.

FOUR RELATED HOW TO's:
As restaurant industry is growing rapidly nowadays, researches show that almost half of the adults have worked in a restaurant or a cafe. Moreover, many of them dream to start their own someday. Unfortunately, it takes a lot of time to write a business plan and to find a great location, although some know how to create a restaurant floor plan in minutes or how to plan budget effortlessly. Hiring employees can also cause a lot of headache, but this is crucial for further success, because every guest comes to restaurant for a good service and delicious food. It is also worth noting that restaurant concept is also important, because it defines target audience and influences the menu. This diagram represents the floor plan of an ongoing sports-theme establishment - restaurant, cafe, or other food service. A number of widescreen monitors installed along the perimeter provide visitors the opportunity to follow the course of a match from anywhere in the dining room of restaurant or cafe. The most of sports fans believe that food and alcohol is a big part of any sports show. That is why the dining room takes the most space - almost 60% of the total establishment space. Nearly all sports fans consume beverages while watching sports - beer, soda or water at least. Thus, the restaurant floor plan designers added a large lavatory there. Moreover, project developers considered unnecessary the gender division of such delicate place - perhaps they guess that only men are watching football, or believe that alcohol will eliminate the most of gender differences.Restaurant Floor Plan
Picture: How To Create Restaurant Floor Plan in Minutes
Related Solution:
The Winter Sports solution for ConceptDraw DIAGRAM provides you with a rich set of olympic games and winter sports pictogram you may need to illustrate tournament schedules or any other kind of information materials.Winter Sports. <br>Using Olympic Games Clipart to Illustrate Tournament Schedule *
Picture: Winter Sports. Using Olympic Games Clipart to Illustrate Tournament Schedule
Related Solution:
"Offsides" is a very basic sports term, which can be very hard to explain to a novice. The fundamental concepts in sports can be extremely difficult to convey without a drawing, that's why we included an Offsides Sample in the Hockey solution. Explaining with ConceptDraw in your playbook is easier than ever before!Ice Hockey Offside Diagram *
Picture: Ice Hockey Offside Diagram
Related Solution:
In the course of recent decades data visualization went through significant development and has become an indispensable tool of journalism, business intelligence and science. The way visual information may be conveyed is not limited simply to static or dynamic representation, it can also be interactive. Infographics can be conditionally divided into several general levels. Primarily, this is level of visualization of information, its interpretation and association on any ground. Second level can be defined as a visualization of knowledge, depiction of thoughts and ideas in the form of images or diagrams. Finally, the level of data visualization, which processes data arrays in charts, enabling the information to be more clearly perceived. You can also identify the main approaches to the creation of infographics: exploratory and narrative. Exploratory method insists on minimalist design in favor of data precision without unnecessary details and is common for scientific researches and anaDesign Pictorial Infographics. <br> Design Infographics *
Picture: Design Pictorial Infographics. Design Infographics
Related Solution:
ConceptDraw
DIAGRAM 17