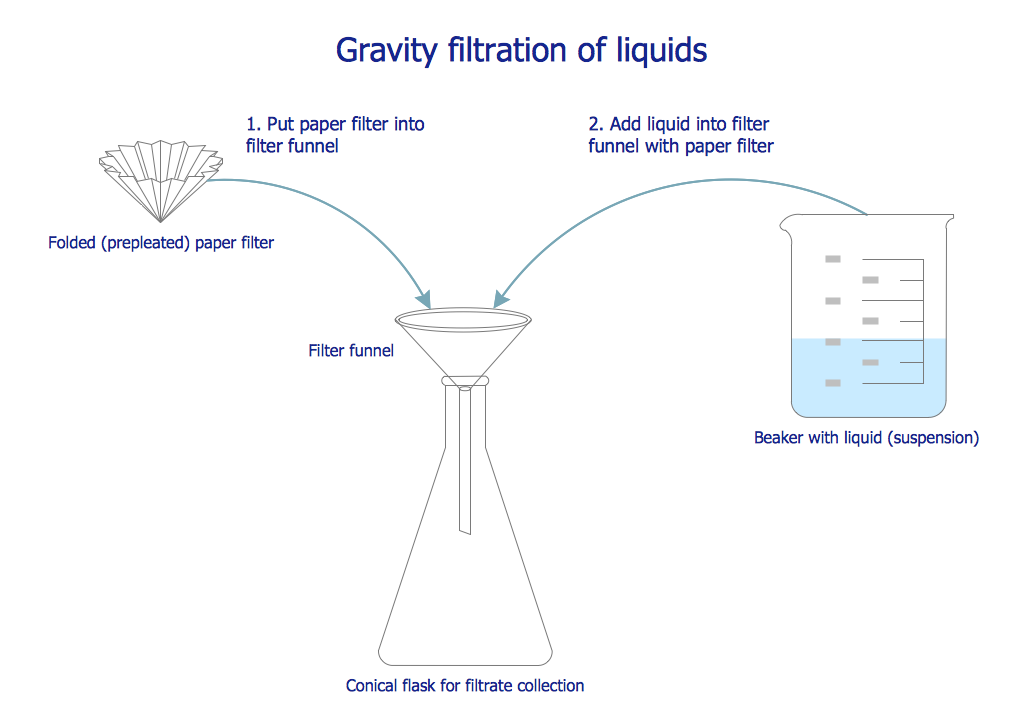
Sample 1. Chemistry symbols and meanings – Chemistry Gravity Filtration of Liquids
This sample was created in ConceptDraw DIAGRAM using the Chemistry Solution. It shows the process of liquid gravity filtration through a prepleated paper filter. An experienced user spent 5 minutes creating this sample.
Use the Chemistry Solution for ConceptDraw DIAGRAM software to create your own professional looking chemical drawings, diagrams, schemes and illustrations of any complexity quick, easy and effective, and then successfully use them.
The chemical schemes designed with ConceptDraw DIAGRAM are vector graphic documents and are available for reviewing, modifying, converting to a variety of formats (image, HTML, PDF file, MS PowerPoint Presentation, Adobe Flash or MS Visio), printing and send via e-mail in one moment.
TEN RELATED HOW TO's:
A Data Flow Diagram (DFD) is a graphical technique which allows effectively model and analyze the information processes and systems. The ability to fast and easy create the DFDs is made possible with Data Flow Diagrams solution from the Software Development area of ConceptDraw Solution Park. For designing the Data Flow Diagrams are used simple DFD flowchart symbols which are connected each other by arrows depicting the data flow from one step to another.
Picture: DFD Flowchart Symbols
Related Solution:
Start design your own flowchart with ConceptDraw DIAGRAM and accomplish great results at the moment.
Picture: Draw Flowcharts with ConceptDraw
Related Solution:
A process flow diagram (PFD) is a diagram commonly used in chemical and process engineering to indicate the general flow of plant processes and equipment.
ConceptDraw DIAGRAM diagramming and vector drawing software extended with Flowcharts Solution from the Diagrams Area of ConceptDraw Solution Park offers the extensive drawing tools for quick and easy design professional looking Process Flow Diagrams.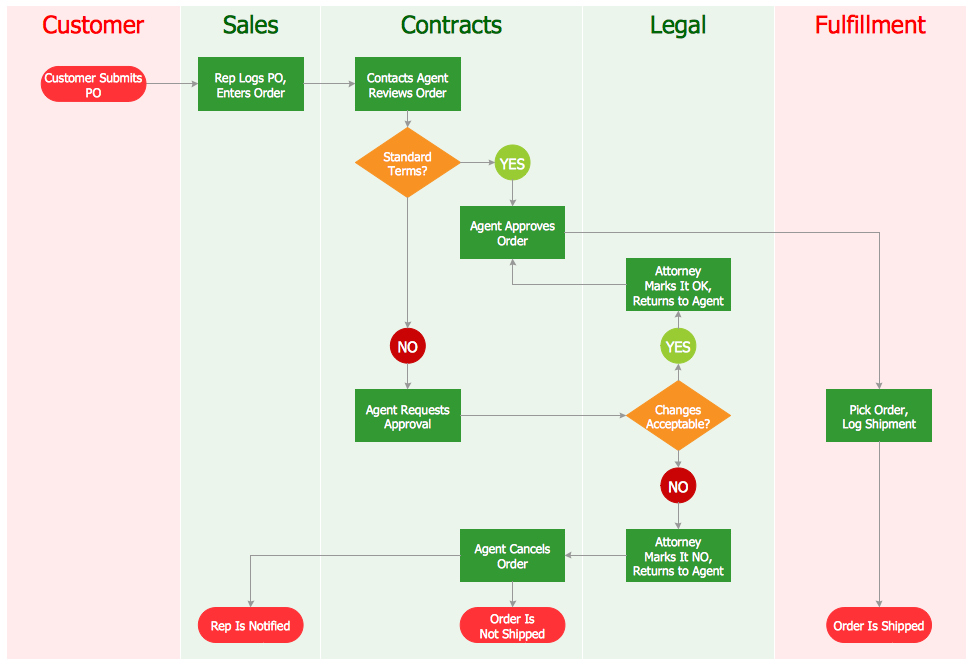
Picture: Process Flow Diagrams
Related Solution:
When studying computer science, it is important to have good training manuals. To understand how the networks and data links work, you will probably need a set of network diagram examples depicting all the possible interconnections between network devices. You can find them on Internet or try to create your own.
This example of a network topology diagram was made using ConceptDraw Computer and Network Diagrams solution. It represents a bus topology network diagram. A bus topology means that computers and peripherals in the network are connected to a mutual cable (backbone). This topology is often used for small networks. This diagram was designed using vector libraries of network equipment symbols. They also can be applied while creating various LAN and WAN diagrams.
Picture: Network Diagram Examples
A concept map is a way of representing relationships between ideas, images, or words.
How to draw a Concept Map quick, easy and effective? ConceptDraw DIAGRAM offers the unique Concept Maps Solution from the Diagrams Area that will help you!
Picture: Concept Map
Related Solution:
A voltage source is a two terminal device which can maintain a fixed voltage. An ideal voltage source can maintain the fixed voltage independent of the load resistance or the output current. However, a real-world voltage source cannot supply unlimited current. A voltage source is the dual of a current source. Real-world sources of electrical energy, such as batteries, generators, and power systems, can be modeled for analysis purposes as a combination of an ideal voltage source and additional combinations of impedance elements.
26 libraries of the Electrical Engineering Solution of ConceptDraw DIAGRAM make your electrical diagramming simple, efficient, and effective. You can simply and quickly drop the ready-to-use objects from libraries into your document to create the electrical diagram.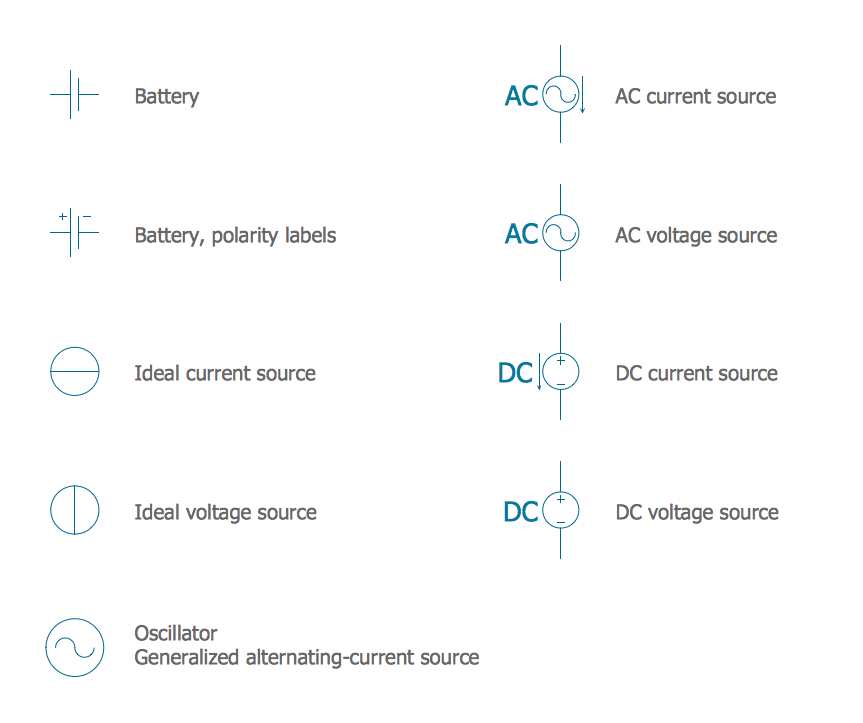
Picture: Electrical Symbols — Power Sources
Related Solution:
Business graphic applications show a special knowledge representations and include many features for creating schematic pictures. These graphic tools are known as flowchart maker or flowchart maker software.
Picture: Flowchart Maker
Related Solution:
When describing any computer network, we imagine a set of devices and nodes, arranged in some way. Talking about network structures, we should distinguish physical and logical network topologies, as physical topology is about devices location and logical topology illustrates data flow. In the same time, they do not have to match, and some devices, such as repeaters, may have a physical star layout, but a bus logical topology.
There are two main types of computer network topologies: Physical topology that show the physical organization of a network - equipment and types of connections. Star network topology involves a set of devices that is connected to a single hub (router). Ring network topology means that, devices connected according this topology have two connections, connecting with nearby devices to make a loop. Bus network topology is the topology presented at the current diagram. It is similar to a ring topology. The difference is that data moves up and down a linear connection, copying itself where network equipment works as bus-stations along the way. This network topology can be used for small network, or when adding an extra device into a network.
Picture: Network Topologies
Related Solution:
Planning a computer network can be a challenge for a junior specialist. However, knowing how to draw a computer network diagrams isn’t a rocket science anymore. There are a lot of special software for creating such diagrams with predesigned templates and examples.
The core for Network Fault Tolerance System presented here, is the equipment of Cisco. You can see here the certified Cisco equipment icons. Generally, ConceptDraw DIAGRAM libraries contain more than half of a thousand objects representing the standardized images of Cisco equipment. ConceptDraw solution for network diagramming is a great network diagramming tool for any level skills - from students to network guru.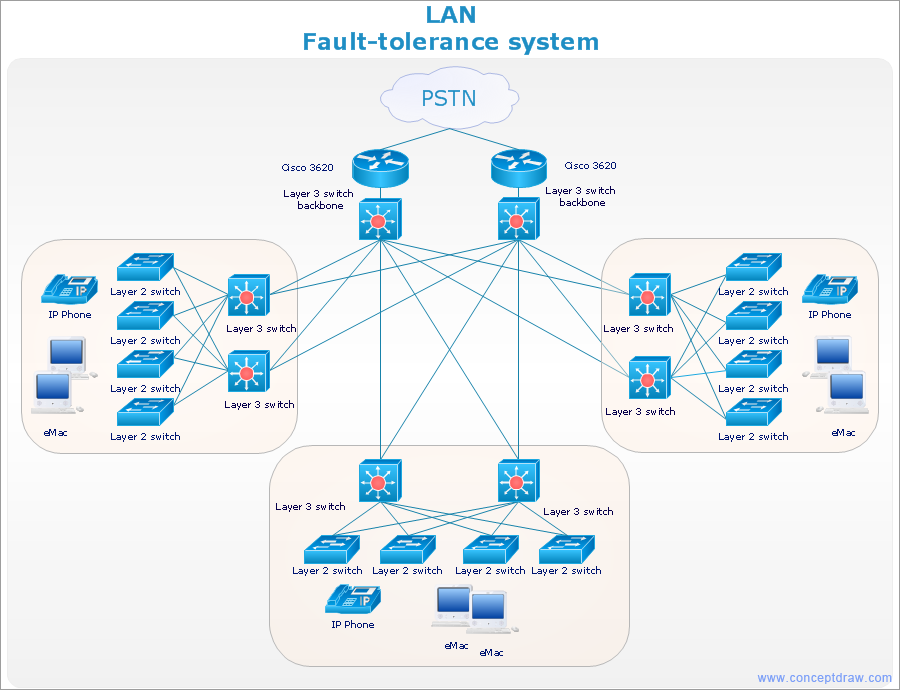
Picture: How to Draw a Computer Network Diagrams
Related Solution:
Entity Relationship Diagram (ERD) is the world-known way to show the logical structure of databases in visual manner. The best software tool for drawing Entity-Relationship Diagram is ConceptDraw DIAGRAM vector graphics software with Entity-Relationship Diagram (ERD) solution from Software Development area which gives the ability to describe a database using the Entity-Relationship model. The vector graphic diagrams produced using this solution can be successfully used in whitepapers, presentations, datasheets, posters, or any technical materials.
Picture: Entity-Relationship Diagram
Related Solution:


