
Sample 2. Chemistry equation symbols – Chemical Drawings Library Design Elements
Use of these predesigned chemistry equation symbols lets you the possibility to draw any chemistry equation. Simply drag the needed objects from the library to the document and arrange them. Use your chemical drawings created in ConceptDraw DIAGRAM in your education, scientific, and any other activity. They will always have a success and you can easily explain your thoughts to the colleagues.

Sample 3. Chemistry Solution – Chemistry Phenols
This sample was created in ConceptDraw DIAGRAM using the chemistry equation symbols from the Chemistry Solution. It shows the scheme of phenols and reactions dependent on their participation. An experienced user spent 20 minutes creating this sample.
The chemical drawings and schemes designed with ConceptDraw DIAGRAM are vector graphic documents and are available for reviewing, modifying, converting to a variety of formats (image, HTML, PDF file, MS PowerPoint Presentation, Adobe Flash or MS Visio), printing and send via e-mail in one moment.
TEN RELATED HOW TO's:
A process flow diagram (PFD) is a diagram commonly used in chemical and process engineering to indicate the general flow of plant processes and equipment.
ConceptDraw DIAGRAM diagramming and vector drawing software extended with Flowcharts Solution from the Diagrams Area of ConceptDraw Solution Park offers the extensive drawing tools for quick and easy design professional looking Process Flow Diagrams.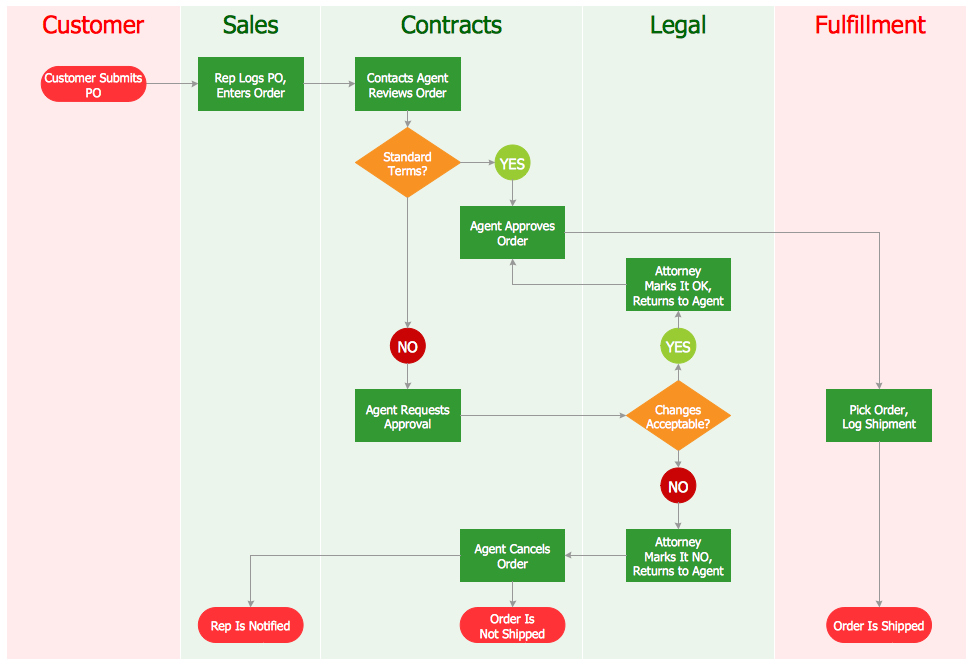
Picture: Process Flow Diagrams
Related Solution:
ConceptDraw DIAGRAM is a flowchart design software. There are large collections of professional flowchart symbols for process flow diagrams, standard flowchart symbols and colored basic flowchart symbols. Built-in examples and video lessons allow users to get started immediately and do drawing of virtually any type of flowchart or process flow diagrams
Picture: Flow Chart Creator
Related Solution:
ConceptDraw DIAGRAM diagramming and vector drawing software provides the unique Flowcharts Solution from the Diagrams Area of ConceptDraw Solution Park with variety of vector objects libraries and collection of examples Flowchart. Each example flowchart included in Flowcharts solution is a real help in drawing process, it can be the good base or perfect source of inspiration.

Picture: Examples Flowchart
Related Solution:
Network infrastructure planning is a very important process in the network construction, and the share of time allocated to this within the scope of the entire project may reach 60-80%. A competent and thorough approach to planning contributes to the quick investment return, and also increases the reliability and flexibility of the final system, reducing the probability of additional costs related to the incorrect implementation.
Any planning begins with an analysis of the business requirements to the final system. Basic network parameters, which should be assessed are the scalability, accessibility, cost, speed and safety.
Speed and cost are often mistaken for the most important parameters, and the rest of the parameters aren't even remembered. This is not entirely correct. Initially, it is necessary to assess the business plans for the future, because sometimes it is more profitable to invest more money in the beginning. If the business is to develop, then, consequently, demands on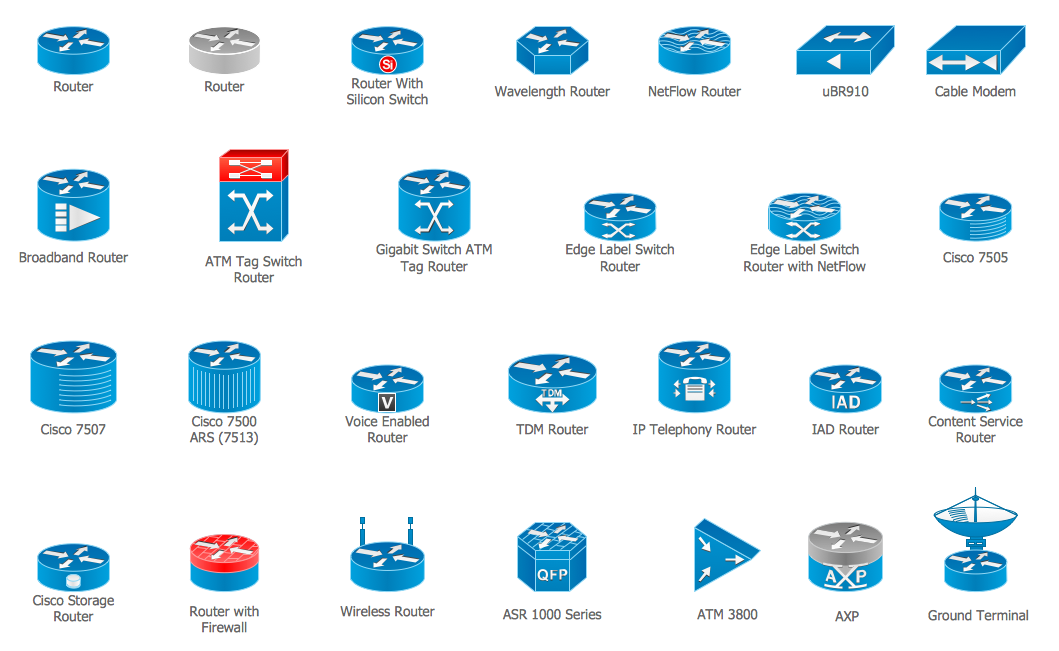
Picture: Cisco Routers. Cisco icons, shapes, stencils and symbols
Related Solution:
Flow chart is a diagrammatic representation of an algorithm and essential part of planning the system. Flow charts are widely used in technical analysis and programming for easy writing programs and explaining them to others. So, one of the most popular type of flow charts is Technical Flow Chart.
Technical Flow Chart can be drawn by pencil on the paper, but it will be easier to use for designing a special software. ConceptDraw DIAGRAM diagramming and vector drawing software extended with Flowcharts Solution from the Diagrams Area of ConceptDraw Solution Park will be useful for this goal.
Picture: Technical Flow Chart
Related Solution:
A technical drawing of a building is called an architectural drawing. According to a set of conventions, a building drawing includes a number of views, as well as unit measurements, scales, sheet sizes, cross referencing and annotation. Computer progress had a major impact of the methods of architectural drawing, making manual drawing almost obsolete. Digital drawing software, such as ConceptDraw DIAGRAM , offers a number of tools for each design element: piping plan, floor plan, etc.
Any building should have its plumbing and piping plans for every room, that has a water supply. Plans are applied to indicate arrangement of piping system in the building. This diagram presents a suite of standard piping icons for making building plans that include plumbing and piping layout. This diagram was designed using ConceptDraw solution for Piping and Plumbing planning. Using symbols is valuable for making a valid piping plan. Because any professional will properly interpreted such plan as a piece of technical documentation of a construction project.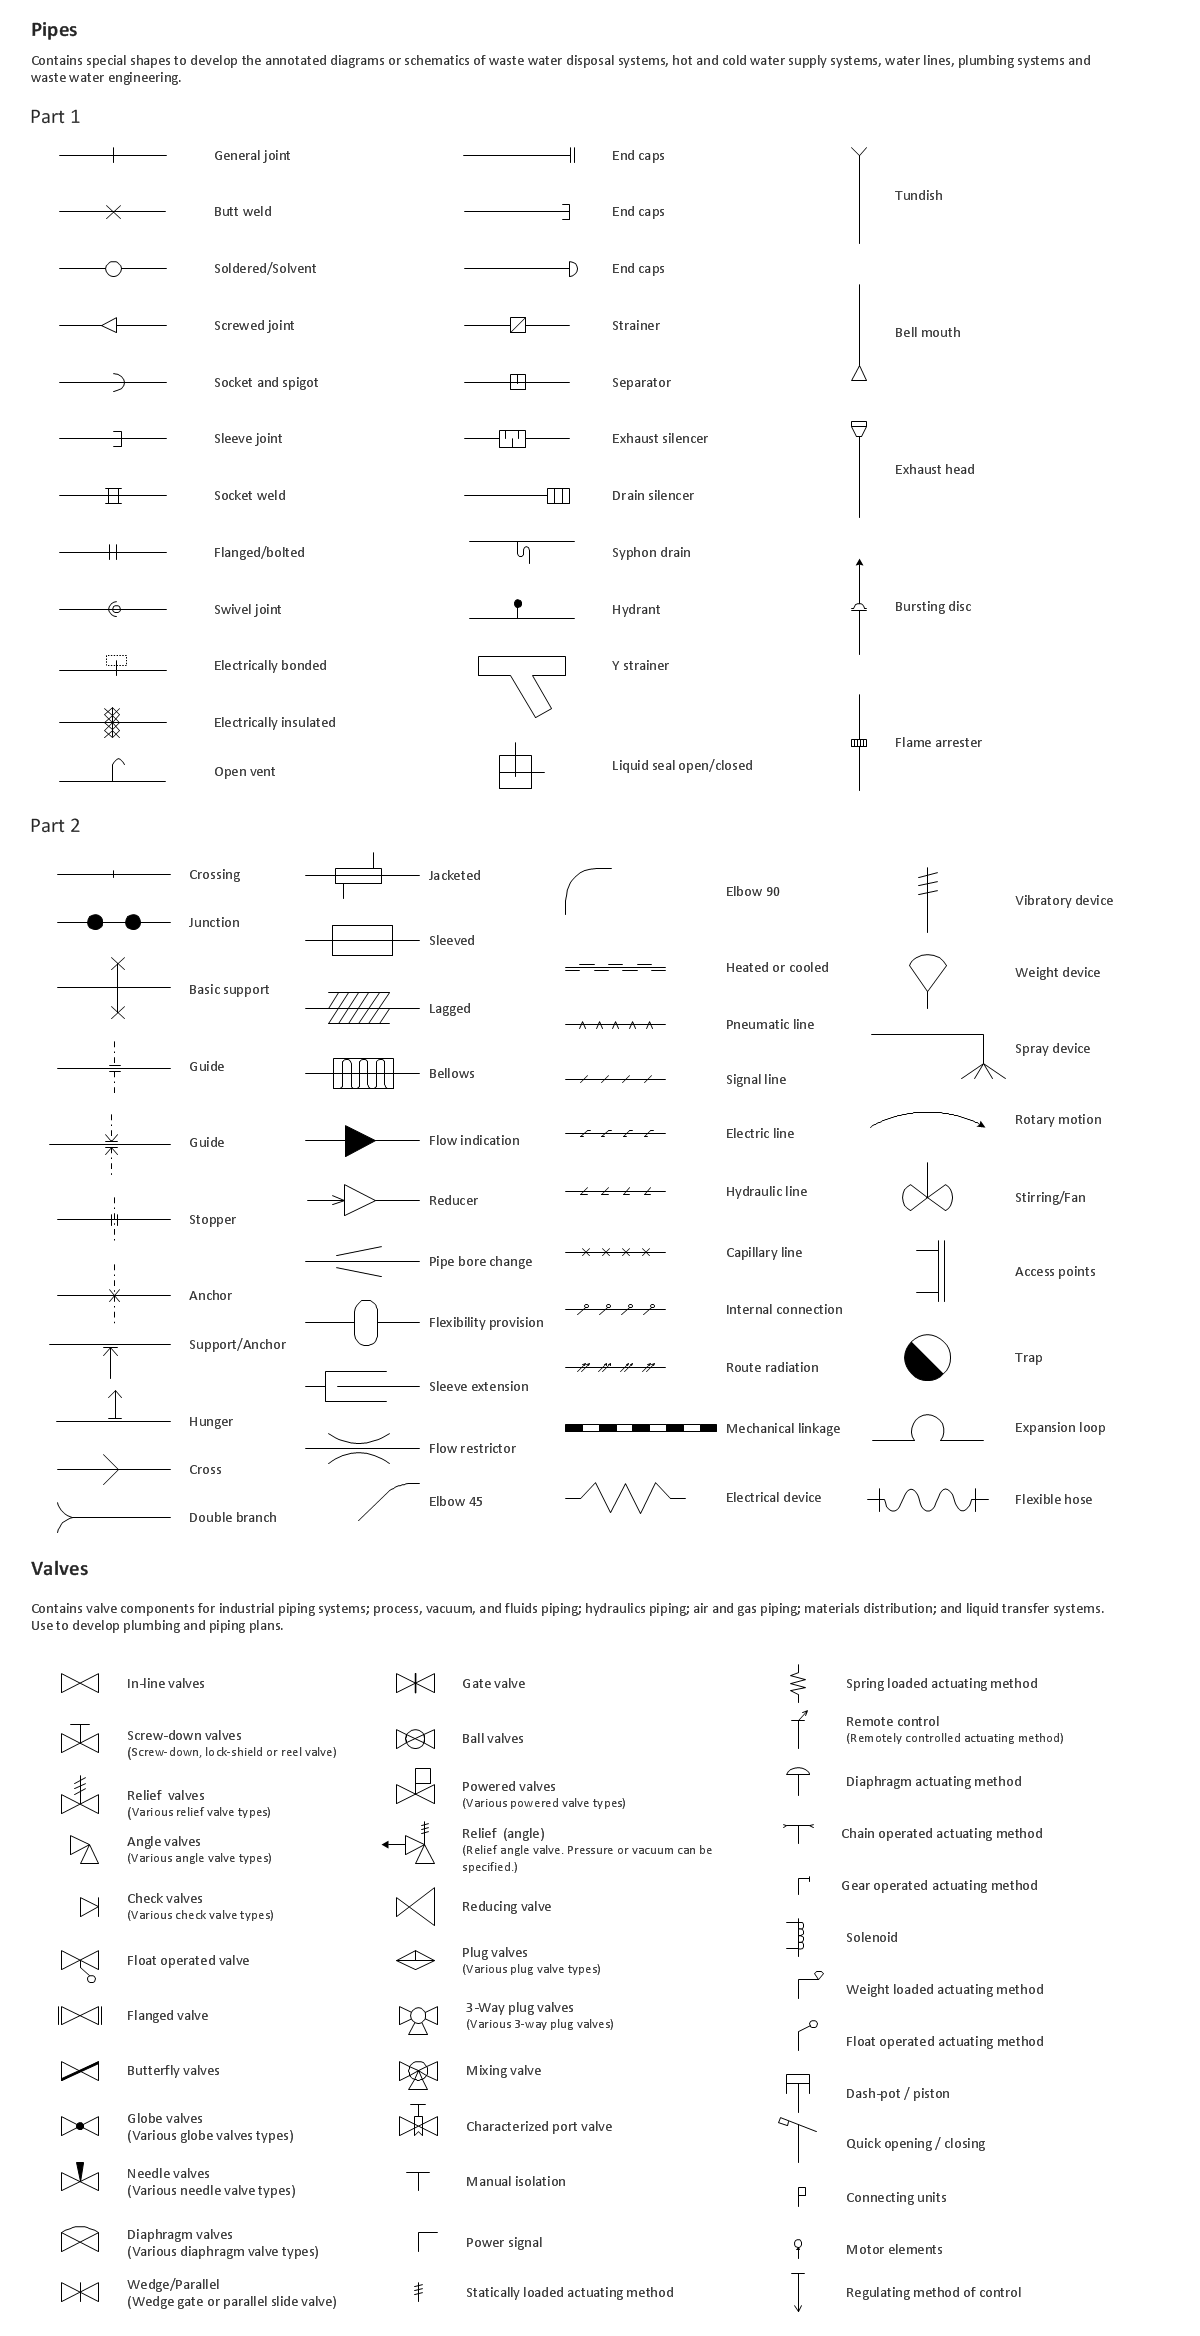
Picture: Building Drawing. Design Element: Piping Plan
Related Solution:
A list of parameters on which networks differ is very long. A large network with a range up to 50 kilometers is called metropolitan area network (MAN), and this type of network can include several local area networks. Metropolitan networks in their turn connect into global area networks.
Here you will see a Metropolitan Area Network (MAN). This is an extensive network which occupies a large territory including a few buildings or even the whole city. The space of the MAN is bigger than LAN, but lower than WAN. MAN comprise a lot of communication equipment and delivers the Internet connection to the LANs in the city area. Computer and Networks solution for ConceptDraw DIAGRAM provides a set of libraries with ready-to-use vector objects to design various kinds of computer networks.
Picture: Metropolitan area networks (MAN). Computer and Network Examples
Related Solution:
Venn diagrams are illustrations used in the branch of mathematics known as set theory.
Create your Venn diagrams for logic problem solving using the ConceptDraw DIAGRAM software
Picture:
Venn Diagram Examples for Problem Solving
Venn Diagram as a Truth Table
Related Solution:
A competent delegation of responsibilities between workers guarantees business success in most cases. At first sight, it might seem that workflow diagram symbols are quite similar to a regular flowchart. But workflow diagram is a more accurate way to present working processes.
Workflow diagrams are helpful for a working process analyzation, to depict a pathway of process issues, personalize responsibilities and identify resources that will help to optimize a workflow. Generally, Workflow diagram deploys flowchart symbols for displaying work process steps and relationships. But, often it require some additions and improvements to become more professional and illustrative. The Workflow solution for ConceptDraw DIAGRAM provides the user with a big library of symbols that are designed especially for workflow diagrams.
Picture: Workflow Diagram Symbols
Related Solution:
ConceptDraw DIAGRAM is a powerful Network Engineering software thanks to the Vehicular Networking Solution and many other networking solutions from the Computer and Networks Area of ConceptDraw Solution Park.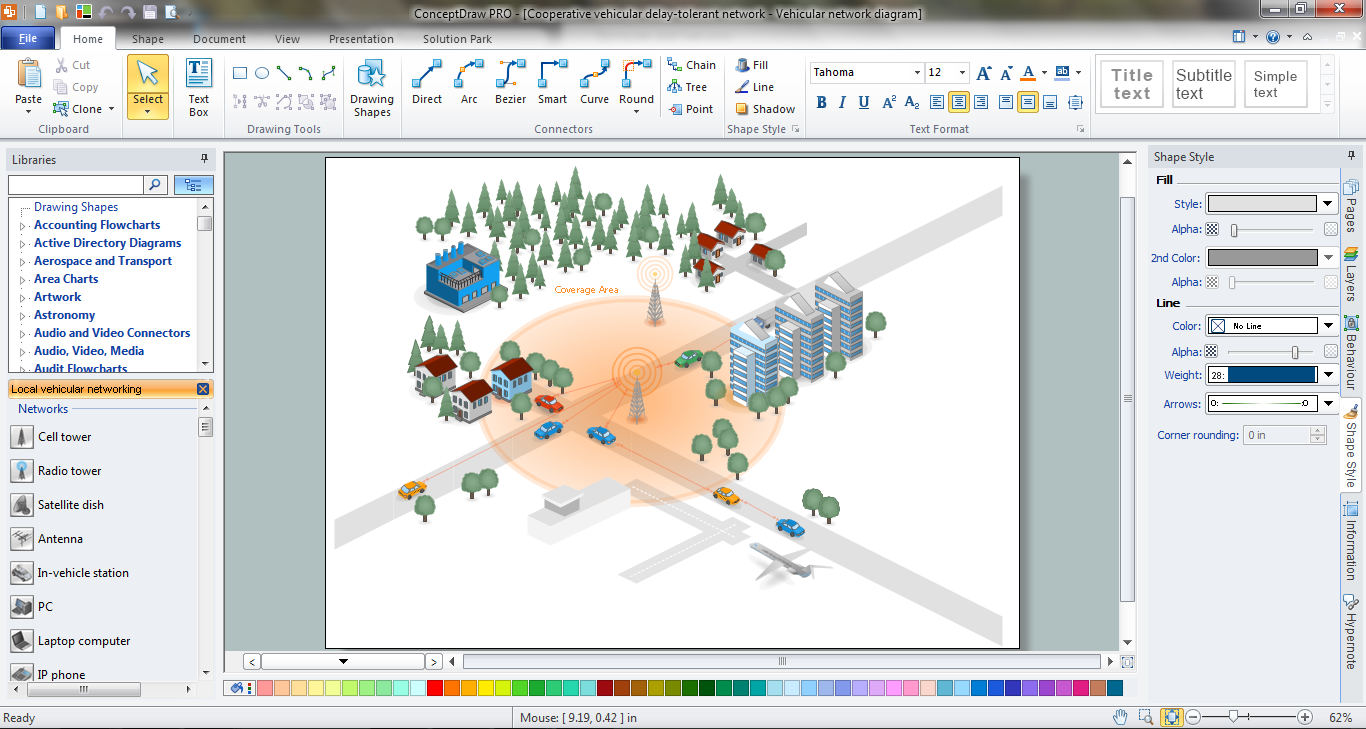
Picture: Network Engineering
Related Solution:

