Example 1. PERT Chart — Project Management
PERT Chart is one of the most commonly used tools from the set of Seven Management and Planning Tools. We are glad to offer the powerful ConceptDraw DIAGRAM software which can effectively help in PERT Chart drawing.

Example 2. PERT Chart Template
It's a perfect possibility to start drawing from the PERT Chart template included in Seven Management and Planning Tools Solution. But if you want to draw your PERT Chart in new document, you can use the predesigned shapes from the PERT Charts library which is also included in Seven Management and Planning Tools Solution.

Example 3. PERT Charts Library Design Elements
Look at the sample above, you can see that PERT Charts library contains a variety of ready-to-use elements which are usually used for creating PERT Charts of any detailing.

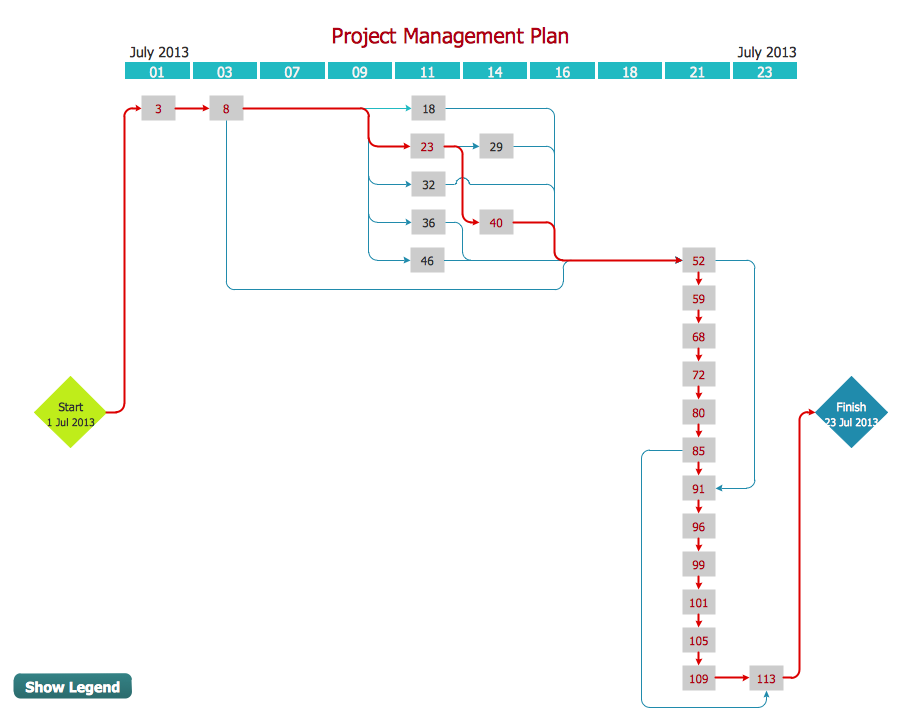
Example 4. PERT Chart — Sales Problem Solution
This sample was created in ConceptDraw DIAGRAM using the Seven Management and Planning Tools Solution for ConceptDraw DIAGRAM and shows the PERT chart for the sale problem solving. The critical path is visually highlighted in red. An experienced user spent 15 minutes creating this chart.
Use the Seven Management and Planning Tools Solution for ConceptDraw DIAGRAM software to create your own professional looking PERT chart quick, easy and effective.
All source documents are vector graphic documents. They are available for reviewing, modifying, or converting to a variety of formats (PDF file, MS PowerPoint, MS Visio, and many other graphic formats) from the ConceptDraw STORE. The Seven Management and Planning Tools Solution is available for all ConceptDraw DIAGRAM or later users.
TEN RELATED HOW TO's:
ConceptDraw DIAGRAM diagramming and vector drawing software extended with Target and Circular Diagrams solution from the Marketing area of ConceptDraw Solution Park is a powerful tool for Daily Schedule Chart design.
Picture: Daily Schedule Chart
Related Solution:
ConceptDraw PROJECT is the Gantt chart software that implements critical path method to provide the user with a wide set of project management tools.
Picture: How to Discover Critical Path on a Gantt Chart
It’s very easy, quick and convenient to draw the Event-driven Process Chain (EPC) diagrams in ConceptDraw DIAGRAM diagramming and vector drawing software using the Event-driven Process Chain Diagrams Solution from the Business Processes area of ConceptDraw Solution Park.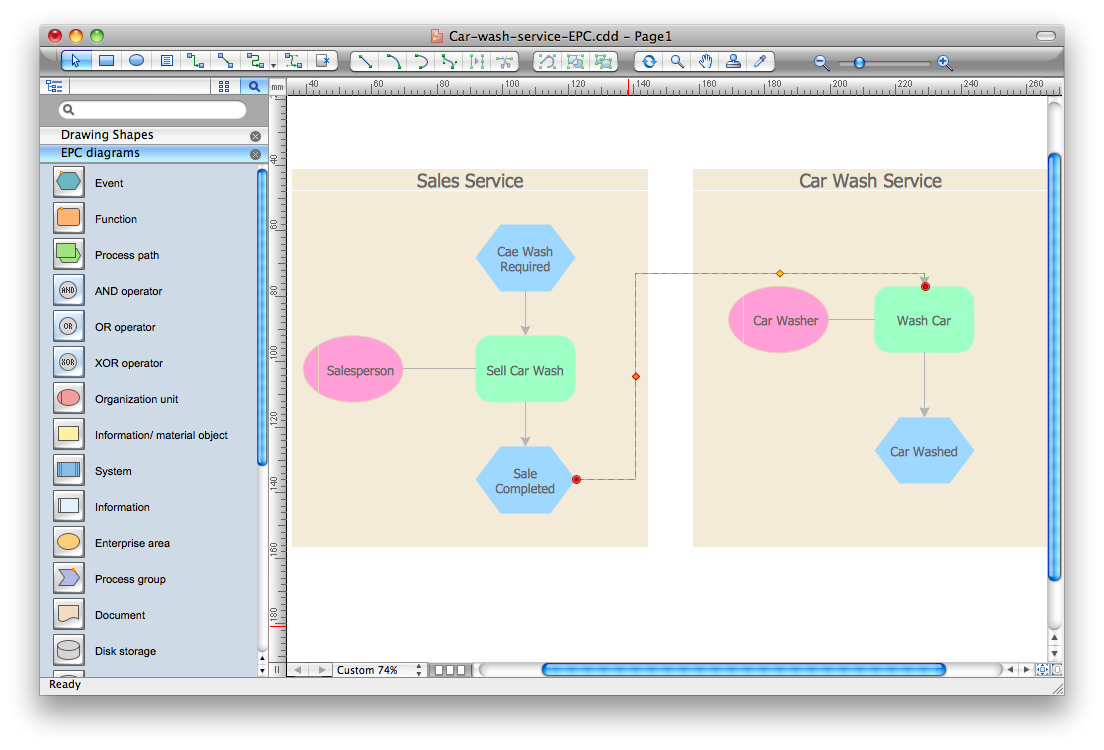
Picture: Event-Driven Process Chain Diagram Software
Related Solution:
ConceptDraw DIAGRAM diagramming and vector drawing software extended with Marketing Diagrams Solution from the Marketing Area of ConceptDraw Solution Park is the best software for quick and easy creating Marketing Flow Chart of any complexity and design.
Picture: Marketing Flow Chart
Related Solution:
ConceptDraw PROJECT is simple project management software for planning projects, it include tools for planning project objectives. This type of project planning software intended for professional who use project terms daily. CoonceptDraw PROJECT can be used as customer project management software to keep on track on-site operations. It often used for planning marketing activity as marketing project management software, also it used as simple project management software for software development projects.
Picture: ConceptDraw PROJECT Project Management Software Tool
Fast visualization of structured data is main capability of the ConceptDraw DIAGRAM. With numerous vector stencils and standard flowchart symbols from object libraries and the RapidDraw technology this program stands as the best professional flowchart software for drawing with type of flowchart symbols. ConceptDraw DIAGRAM also known as best flowchart maker.
Picture: Easy Flowchart Program and Standard Flowchart Symbols
Related Solution:
Activity Network and Project Evaluation and Review Technique, or PERT, charts are a way of documenting and analyzing the tasks in a project.
This diagram is constructed as part of the process in creating a schedule of corrective actions. The Activity Network Chart (PERT) shows the logical connections and consequence of tasks to be performed. It displays the time period for problem solving and the implementation of all activities through the critical path.
Picture: Activity Network (PERT) Chart
Related Solution:
Activity on Node Network Diagramming Tool - Activity Network and Project Evaluation and Review Technique, or PERT, charts are a way of documenting and analyzing the tasks in a project.
This sample shows the Activity on node network diagramming method. It was created in ConceptDraw DIAGRAM diagramming and vector drawing software using the Seven Management and Planning Tools solution from the Management area of ConceptDraw Solution Park.
Picture: Activity on Node Network Diagramming Tool
Related Solution:
Everyone wants to be efficient. To succeed, try Mind Maps for Business - SWOT Analysis and enjoy the result. But be careful: it can be addictive!
ConceptDraw products and supported by SWOT and TOWS Matrix Diagrams solution forms a great tool for providing SWOT analysis. The solution contains mind map templates. By filling mind map templates, one can easily determine Strengths, Weaknesses, Opportunities, and Threats of the current business. Just a one click is needed to turn the SWOT mind map into a SWOT matrix. The SWOT diagram will be created in ConceptDraw DIAGRAM on the base of SWOT mind map.
Picture: Mind Maps for Business - SWOT Analysis
All Gantt charts were made using ConceptDraw PROJECT. ConceptDraw PROJECT works both on Windows and Mac OS X. It allows to schedule a voluntary number of projects in a single Workspace document and lets easily share tasks and resources among them. ConceptDraw PROJECT shares files among Windows and Mac OS X.
Picture: Gantt chart examples


