Pic.1. ConceptDraw DIAGRAM software for event-driven process chain (EPC) diagrams.
The Event-driven Process Chain Diagrams provides templates, samples and libraries with large quantity of vector objects to help you create the EPC diagrams of any difficulty in a few minutes.

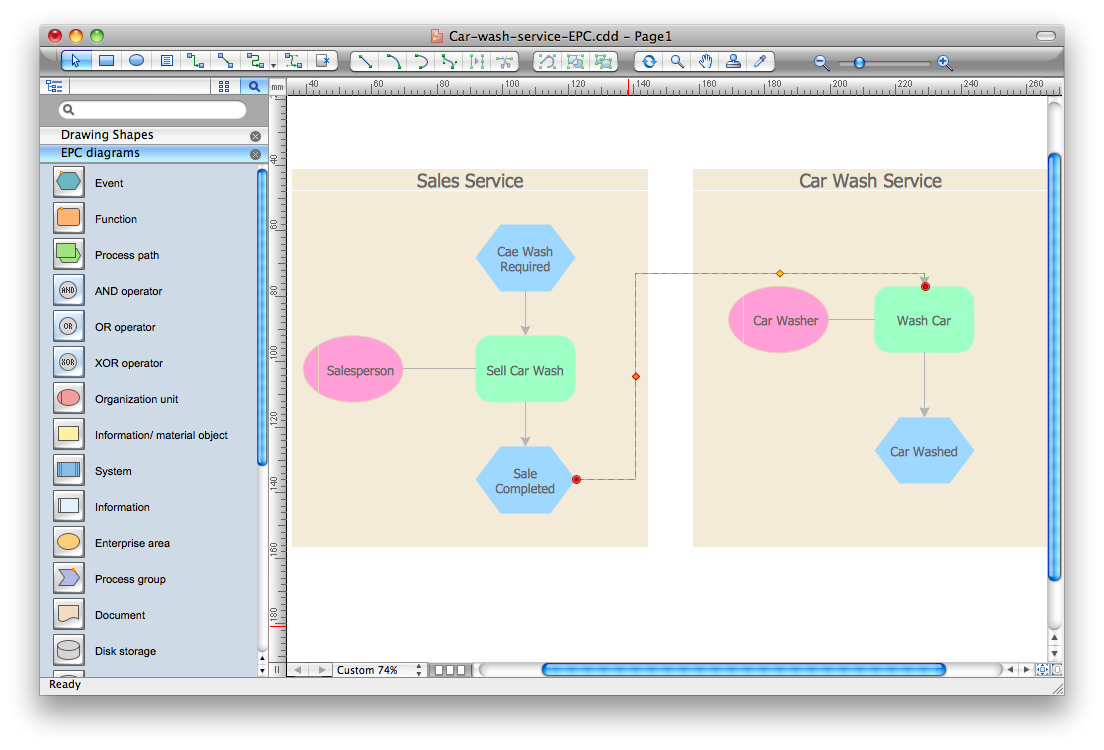
Pic.2. Car wash service EPC diagram.
The Event-driven Process Chain (EPC) diagrams produced with ConceptDraw DIAGRAM are vector graphic documents and are available for reviewing, modifying, converting to a variety of formats (image, HTML, PDF file, MS PowerPoint Presentation, Adobe Flash or MS Visio), printing and send via e-mail in one moment.
TEN RELATED HOW TO's:
This will let you create professional diagrams and charts using its simple RapidDraw option just in clicks. Take a look on a diagram you are looking for and create it fast and quickly.
Picture: Powerful Drawing Feature for Creating Professional Diagrams
The HR Management Software is an incredibly powerful tool for those who need to analyze or present human resource process flows in a visually effective manner.
Picture: HR Management Software
Related Solution:
My friend works as a marketologist. Once he asked me about Marketing and Sales Organization chart, as it was new for him. Luckily, ConceptDraw Solution Park has tons of examples to show to an unexperienced user.
This organizational chart was designed with ConceptDraw DIAGRAM and its Organizational Charts solution, that can be find in the Management section of Solution Park. This solution offers a vector objects library and a set of samples and templates. The vector library contains symbols and icons that provide you with possibility to show the organizational structure of your organization at a glance. It allows to depict the interrelations of authority and responsibility between positions in an organization. Organizational charts provide both employers and employees a clear view of the sale and marketing departments structure, reporting system, management levels.
Picture: Marketing and Sales Organization chart.Organization chart Example
Related Solution:
Separated into categories of Basic, Intermediate, and Advanced categories, the new instructional videos about ConceptDraw PROJECT cover a huge breadth of topics. Users new to ConceptDraw PROJECT will find the Basic lessons an essential platform for familiarizing themselves with the programs′s functions. This video lesson is the first in Basic lessons series.
Picture: What Constitutes a Project?
Activity Network Diagram - This sample was created in ConceptDraw DIAGRAM diagramming and vector drawing software using the Seven Management and Planning Tools solution from the Management area of ConceptDraw Solution Park.
This sample shows the PERT (Program Evaluation Review Technique) chart of the request on proposal. A request for proposal (RFP) is a request of the company or the organization to potential suppliers to submit the business proposals for service or goods that it is interested to purchase. The RFP is represented on the initial procurement stage and allows to define the risks and benefits.
Picture: Activity Network Diagram Method
Related Solution:
You need create a Sales Process Map? Use the ConceptDraw DIAGRAM software which is ideal for the sales process management, marketing and engineering thanks to the powerful Sales Flowcharts solution from the Marketing area of ConceptDraw Solution Park.
Picture: Sales Process Map
Related Solution:
A flowchart is a powerful tool for examining processes. It helps improving processes a lot, as it becomes much easier to communicate between involved people, to identify potential problems and to optimize workflow. There are flowcharts of different shapes, sizes and types of flowchart vary from quite basic process flowcharts to complex program flowcharts. Nevertheless, all these diagrams use the same set of special symbols like arrows to connect blocks, parallelogram to show data receiving or rectangles for showing process steps.
Basic flowcharts are used to represent a simple process algorithm. A basic flowchart notation consists of rectangles (business processes), arrows (the flow of information, documents, etc.). The same notation is used in items such as the "decision", which allow you to do the branching. To indicate the start of the entire business process and its termination can be used the "Terminator" element. The advantages of Basic Flowchart are simplicity and clarity. With it you can quickly describe the business process steps. Creating of Basic Flowchart does not require any special knowledge, as easily understand by employees with different levels of education and IQ.
Picture: Types of Flowchart: Comprehensive Overview
Related Solution:
ConceptDraw has several examples that help you to start using software for designing UML Use Case Diagrams.
Picture: UML Use Case Diagrams
Value Stream Mapping is both a communication and strategic planning tool. VSM helps to analyze and improve processes in order to understand your business better. It is especially useful to use VSM for analyzing and managing the process steps, finding and eliminating waste and items that don’t add value to the product. The use of the ConceptDraw DIAGRAM VSM program and Value Stream Mapping solution is the fastest way to construct the best-looking Value Stream Maps.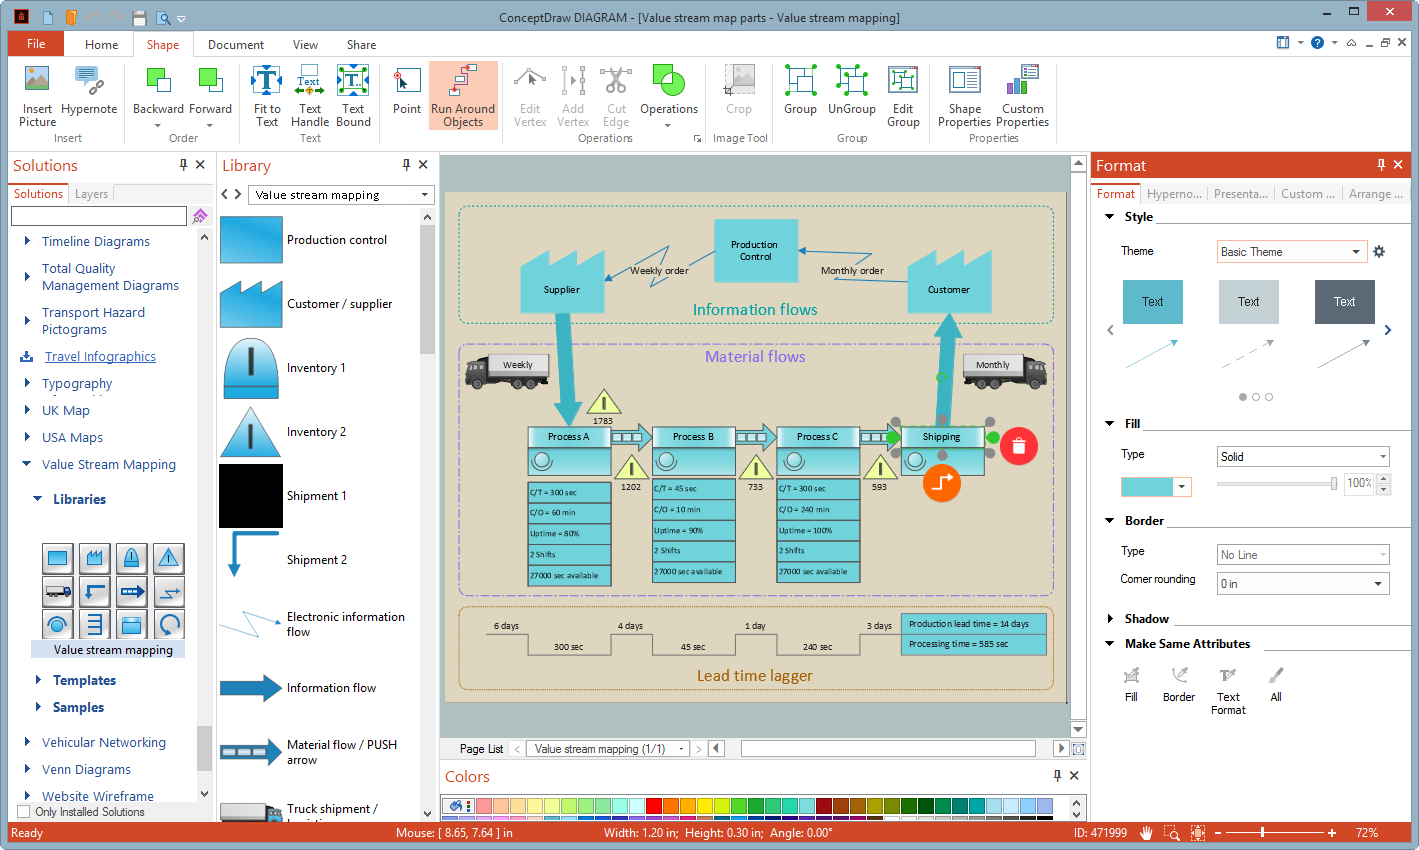
Picture: VSM Program
Related Solution:
Networking and Content Delivery icons - Amazon AWS pro diagrams - AWS diagrams are part of architecturing tools provided with ConceptDraw Solution Park.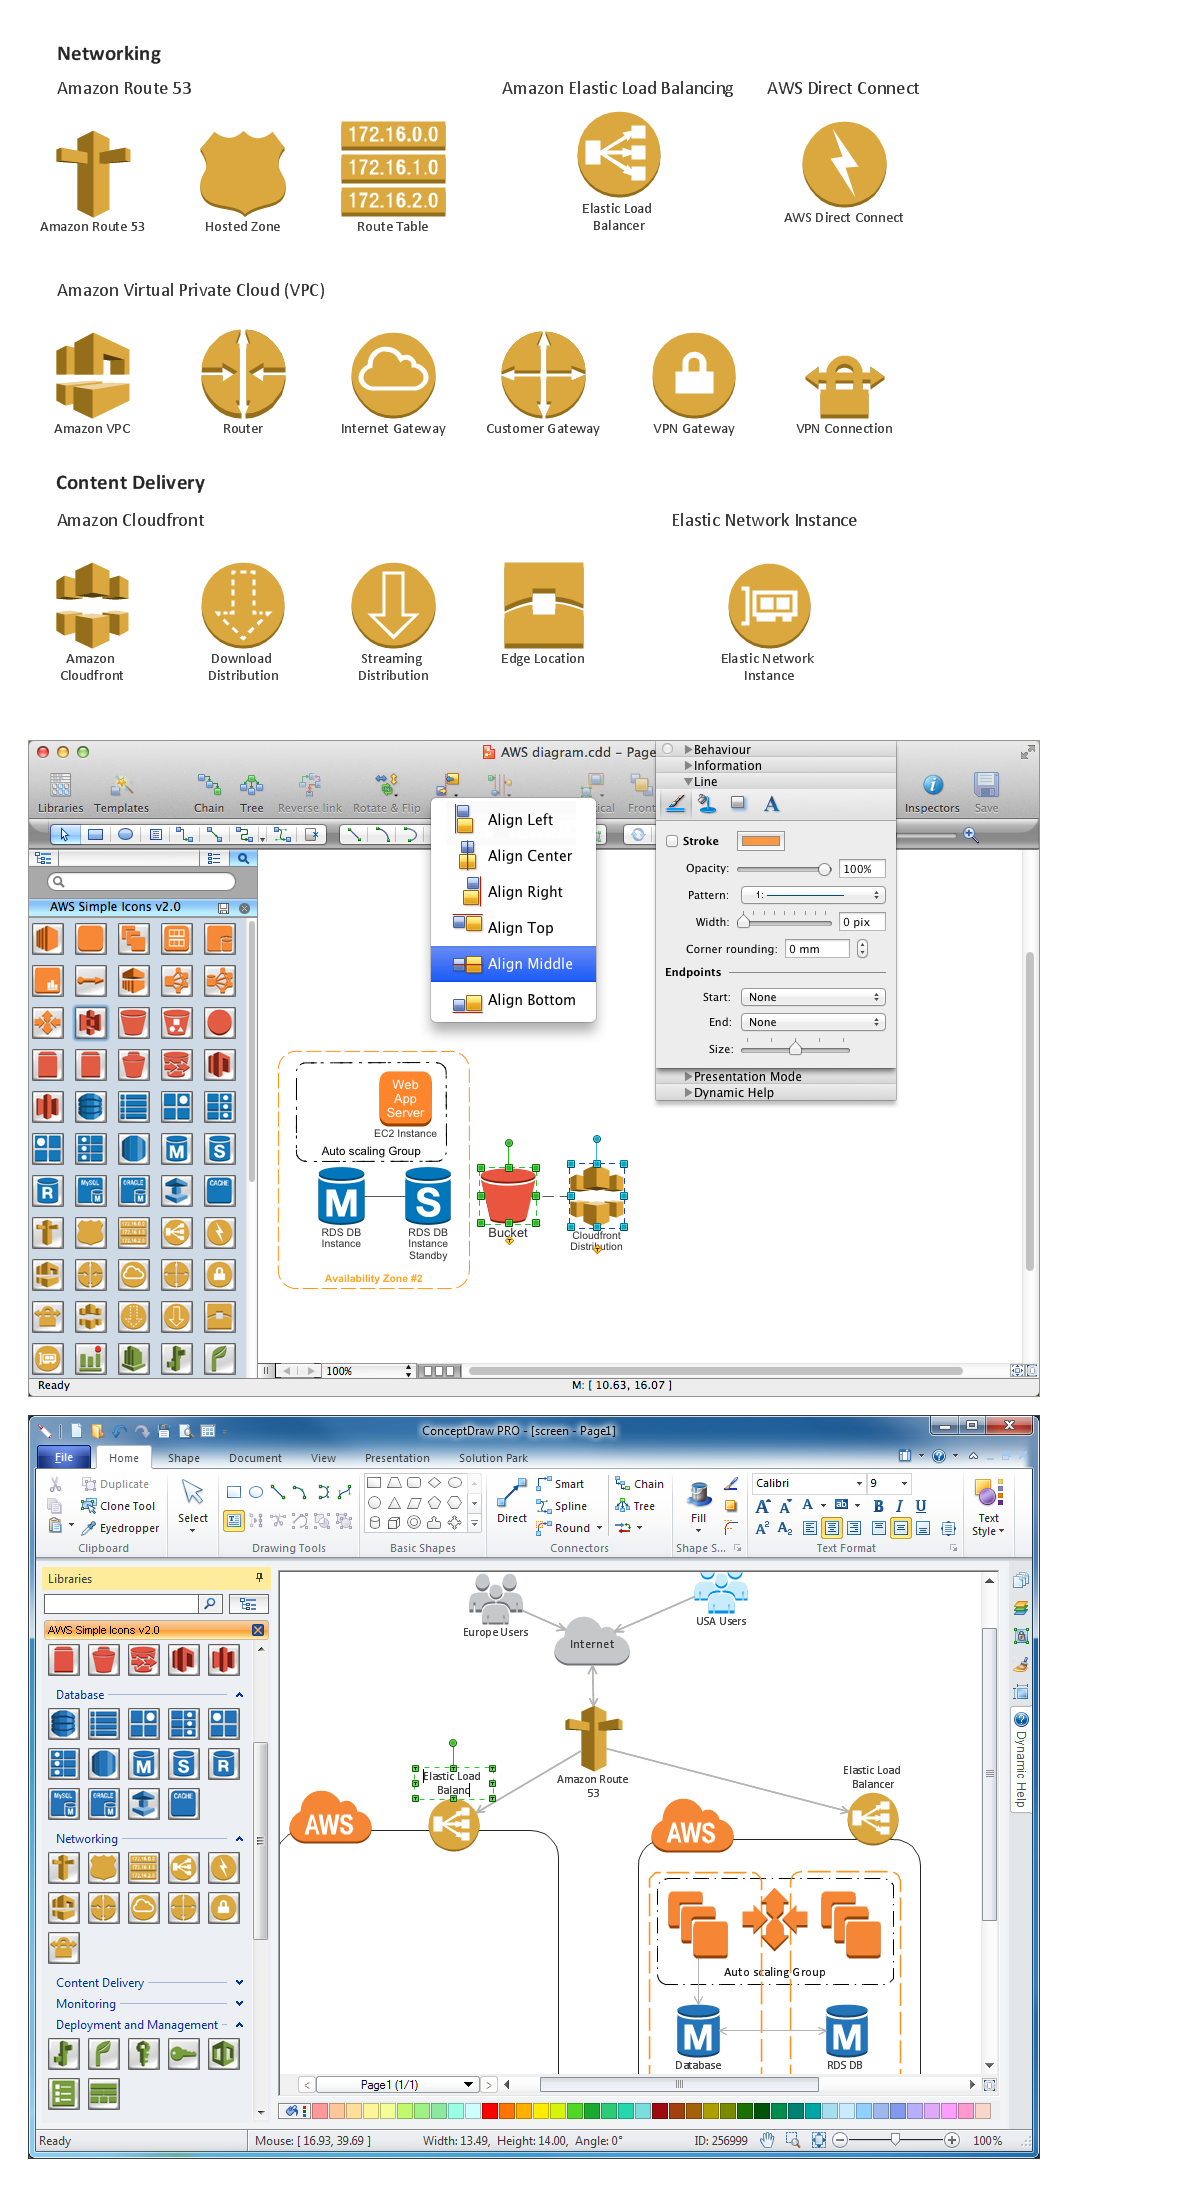
Picture: Diagramming software for Amazon Web Service icon set: Networking and Content Delivery