How should diagramming software work? Is it possible to develop a diagram as quickly as the ideas come to you?
The innovative ConceptDraw Arrows10 Technology included in ConceptDraw DIAGRAM is a powerful drawing tool that changes the way diagrams are produced.
While making the drawing process easier and faster.
ConceptDraw DIAGRAM is a powerful tool that helps you create a process map diagram quickly and easily. Fine-tuning the objects in ConceptDraw DIAGRAM allows you to create a really professional finished article. ConceptDraw Arrows10 Technology gives drawing connectors a smart behavior that provides quick and precise placement, allows for easy changes and automatic rearrangement.
The "chain" mode connects every new shape to the previous one. If you want to create a new branch in your diagram, you just deselect the current chain and select the new shape, which will be the root for this branch, turn the "chain" mode on again and then continue adding shapes. The "chain" auto connection mode is convenient for drawing flowcharts and business process diagrams.
Drawing diagrams fast
How should diagramming software work? Is it possible to develop a diagram as quickly as the ideas come to you?
The innovative ConceptDraw Arrows10 Technology included in ConceptDraw DIAGRAM is a powerful drawing flowcharting software that changes the way diagrams are produced.
While making the drawing process easier and faster.
ConceptDraw DIAGRAM is a powerful tool that helps you create professional looking cross-functional flowcharts with the well-designed objects. ConceptDraw DIAGRAM allows you to focus on work, not the drawing process. ConceptDraw Arrows10 Technology allows to draw connectors with smart behavior that gives flexibility to you during work process.
Sample 1. Block diagram - Automotive HVAC system.
ConceptDraw DIAGRAM diagramming software provides vector shapes and connector tools for quick and easy drawing diagrams for business, technology, science and education.
Use ConceptDraw DIAGRAM enhanced with solutions from ConceptDraw Solution Park to create diagrams to present and explain structures, process flows, logical relationships, networks, design schemes and other visually organized information and knowledge.
You need design the Functional Block Diagram and dream to find the useful tools to draw it easier, quickly and effectively? ConceptDraw DIAGRAM offers the Block Diagrams Solution from the Diagrams Area which will help you!
Nowadays, it's easy to create any drawing with appropriate software tools. Special Seating Plan solution from Building Plans area has all the design elements possible to create any seating plan that you might need. It might be a plan of a theater, or a cinema or even a wedding plan.
A seating plan is an indispensable element of any public event organization. Well thought-out arrangement of seats, furniture and other items help making the event a successful and effective. If you are organizing a spectacular event in a big theater or in a banquet hall, ConceptDraw Seating Plans solution is the tool for you. Especially its library of graphic elements for large and small blocks of seats, stairs, sectors, stage and backstage - just 67 vector objects. The Seating Plans Solution is specially developed for seating plans easy construction. With the help of this solution you'll quickly sketched the seating plan for any event
Picture: Building Drawing Software for Design Seating Plan
If you are an advanced diagramming software user, you might use it daily. Traversing the Internet in searching of alternative to MS Visio for MAC and PC, you can fulfill all your requirements with ConceptDraw DIAGRAM. Don’t hesitate to transfer your documents to another operating system.
When looking for a smart and simple tool for business diagrams as alternative to MS Visio for Apple OS X platform, ConceptDraw DIAGRAM certainly is the best choice. Making many kinds of business charts, numerous technical drawings is what ConcepDraw DIAGRAM is the best. One can easy create any diagram and complete it perfectly and quickly. The big collection of vector object libraries, templates and samples, make it the best Microsoft Visio alternative: ConceptDraw DIAGRAM is simpler to use, less expensive, and supports project management and mind mapping methods.
Picture:
In Searching of Alternative to MS Visio for Mac and PC
ConceptDraw DIAGRAM creates drawings, flowcharts, block diagrams, bar charts, histograms, pie charts, divided bar diagrams, line graphs, area charts, scatter plots, circular arrows diagrams, Venn diagrams, bubble diagrams with great visual appeal on Mac OS X.
When trying to figure out the nature of the problems occurring within a project, there are many ways to develop such understanding. One of the most common ways to document processes for further improvement is to draw a process flowchart, which depicts the activities of the process arranged in sequential order — this is business process management. ConceptDraw DIAGRAM is business process mapping software with impressive range of productivity features for business process management and classic project management. This business process management software is helpful for many purposes from different payment processes, or manufacturing processes to chemical processes. Business process mapping flowcharts helps clarify the actual workflow of different people engaged in the same process. This samples were made with ConceptDraw DIAGRAM — business process mapping software for flowcharting and used as classic visio alternative because its briefly named "visio for mac" and for windows, this sort of software named the business process management tools.
This flowchart diagram shows a process flow of project management. The diagram that is presented here depicts the project life cycle that is basic for the most of project management methods. Breaking a project into phases allows to track it in the proper manner. Through separation on phases, the total workflow of a project is divided into some foreseeable components, thus making it easier to follow the project status. A project life cycle commonly includes: initiation, definition, design, development and implementation phases. Distinguished method to show parallel and interdependent processes, as well as project life cycle relationships. A flowchart diagram is often used as visual guide to project. For instance, it used by marketing project management software for visualizing stages of marketing activities or as project management workflow tools. Created with ConceptDraw DIAGRAM — business process mapping software which is flowcharting visio alternative or shortly its visio for mac, this sort of software platform often named the business process management tools.
Picture: Process Flowchart: A Step-by-Step Comprehensive Guide
How should diagramming software work? The answer is - Fast and easy.
Tree- mode drawing works like that. Just select objects in your drawing and press Tree or Chain button to connect all of them just in one click.
Your diagram looks professional and it took only a moment to draw.
Create bar charts for event management problem solving and visual data comparison using the ConceptDraw DIAGRAM diagramming and vector drawing software extended with the Bar Graphs Solution from the Graphs and Charts area of ConceptDraw Solition Park.
Picture: Bar Diagrams for Problem Solving.Create event management bar charts with Bar Graphs Solution
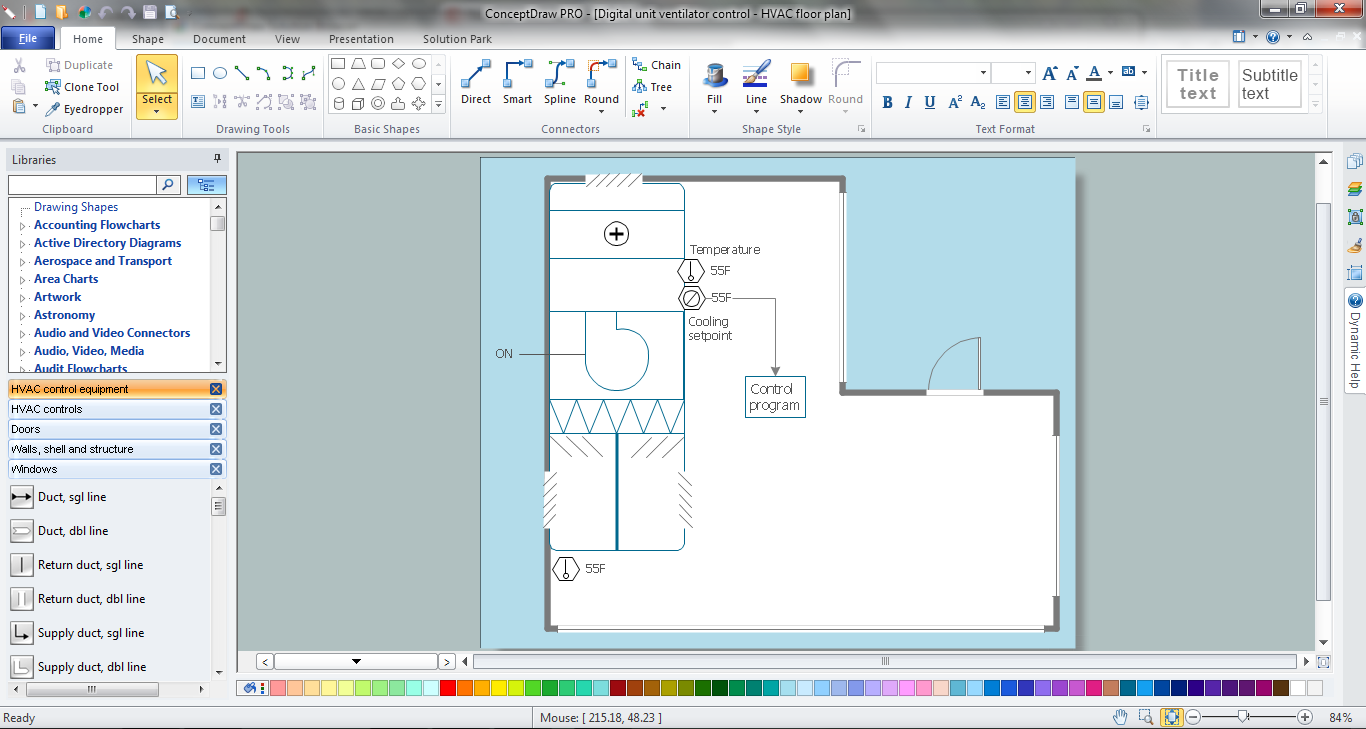
Usually for drawing HVAC plans you need make a lot of efforts and spend a considerable amount of time. ConceptDraw DIAGRAM software will help you radically change this. HVAC Marketing Plan design without efforts? It is reality with HVAC Plans Solution from the Building Plans Area of ConceptDraw DIAGRAM Solution Park.