
Example 1. Cause and Effect Diagram Software
As a first step of creation Cause and Effect diagram for solving a problem, you need to clearly define an effect, put it as a "head" on your diagram and draw a "fish spine" as a horizontal line. The second step is to brainstorm the possible influencing factors and causes, and represent them as "bones" on a diagram. You can construct a few levels of causes, if needed. As a brainstorming software we recommend to use the ConceptDraw MindMap application.

Example 2. Fishbone Diagrams Solution in ConceptDraw STORE
For easy realization all these steps, use the predesigned elements from the Fishbone Diagrams library for Fishbone Diagrams Solution, or start with one of predesigned templates offered at ConceptDraw STORE. You can also orient on ready Fishbone diagram samples and use them as the base when drawing your own charts and illustrations.

Example 3. Cause and Effect Diagram - Factors Reducing Competitiveness
The following features make ConceptDraw DIAGRAM extended with the Fishbone Diagrams solution the most effective Cause and Effect Diagram software:
- You don't need to be an artist to draw professional looking diagrams in a few minutes.
- Large quantity of ready-to-use vector objects makes drawing your diagrams quick and easy.
- Extensive collection of pre-designed templates and samples give you a great start for your own diagrams.
- ConceptDraw DIAGRAM provides you with the possibility to use the grid, rules and guides. You can easily rotate, group, align, and arrange objects, and use different fonts and colors to make your diagram stand out.
- All ConceptDraw DIAGRAM documents are vector graphic files and are available for reviewing, modifying, and converting to a variety of formats: image, HTML, PDF file, MS PowerPoint Presentation, Adobe Flash, MS Visio.
- Using ConceptDraw STORE you can navigate through ConceptDraw Solution Park, managing downloads and updates. You can access libraries, templates and samples directly from ConceptDraw STORE.
- If you have any questions, our support is free of charge and always ready to come to your aid.
TEN RELATED HOW TO's:
ConceptDraw DIAGRAM has the powerful tools for rapid drawing Fishbone diagrams and identifying many possible causes for an effect for problem solving. Causes can be grouped into major categories to identify these sources of variation. Easy create Fishbone diagrams with the ConceptDraw DIAGRAM software and Fishbone Diagrams solution included to ConceptDraw Solution Park!
Picture: Create Fishbone Diagrams with the ConceptDraw
Related Solution:
What is organizational charts and why your business need them? How to use business process diagram software? Explore how advanced organization chart software transforms the way companies ✔️ visualize, ✔️ communicate, and ✔️ streamline their organizational hierarchies
Picture:
What is an Organizational Chart and how it works?
Organization Chart Software
Related Solution:
The Entity-Relationship Diagram (ERD) solution from ConceptDraw Solution Park extends ConceptDraw DIAGRAM vector graphics and diagramming software with the ability to describe a database using the Entity-Relationship (Chen) model. Use it for design your ERDs and verify that ConceptDraw DIAGRAM offers the best ERD diagrams software tools for design element Chen notation._Win_Mac.png)
Picture: Entity Relationship Diagram - ERD - Software for Design Chen ER Diagrams
Related Solution:
An abstract representation is usually the first thing you will need while developing a database. To understand the ways that databases are structured, you should look through entity-relationship diagram examples and see the notations features and attributes. With an entity-relationship model you can describe a database of any complexity.
This Entity-relationship diagram is a tool for software developers. It enables every element of database to be managed, communicated and tested before release. This ERD was created using symbols advocated by Chen's notation. Because of a linguistic origin of the Chen’s notation, the boxes representing entities could be interpreted as nouns, and the relationships between them are in verb form, shown on a diagram as a diamond.
Picture: Entity Relationship Diagram Examples
Related Solution:
Visual information is easier to perceive. You can teach even a child to make diagrams with a good flowchart example that would be interesting for it. Flowcharts can be fun, it’s not about business processes or programming algorithms.
This flowchart shows step by step process of manufacturing of Nixtamal The product which is obtained by processing maize with calcium hydroxide. We must assume that the Aztecs were very fond of this product, if the recipe of its production came to our times. This flow chart was designed using ConceptDraw DIAGRAM with its solution for designing flowcharts of various types, sizes and purposes. ConceptDraw Flowcharts solution consists from the library of flowchart symbols, containing the set vector objects. Also there are a lot of diverse templates and samples of flow charts.
Picture: Flowchart Examples and Templates
Related Solution:
Electronic components have two or more electrical terminals (or leads) aside from antennas which may only have one terminal. These leads connect to create an electronic circuit with a particular function (for example an amplifier, radio receiver, or oscillator). Basic electronic components may be packaged discretely, as arrays or networks of like components, or integrated inside of packages such as semiconductor integrated circuits, hybrid integrated circuits, or thick film devices.
26 libraries of the Electrical Engineering Solution of ConceptDraw DIAGRAM make your electrical diagramming simple, efficient, and effective. You can simply and quickly drop the ready-to-use objects from libraries into your document to create the electrical diagram.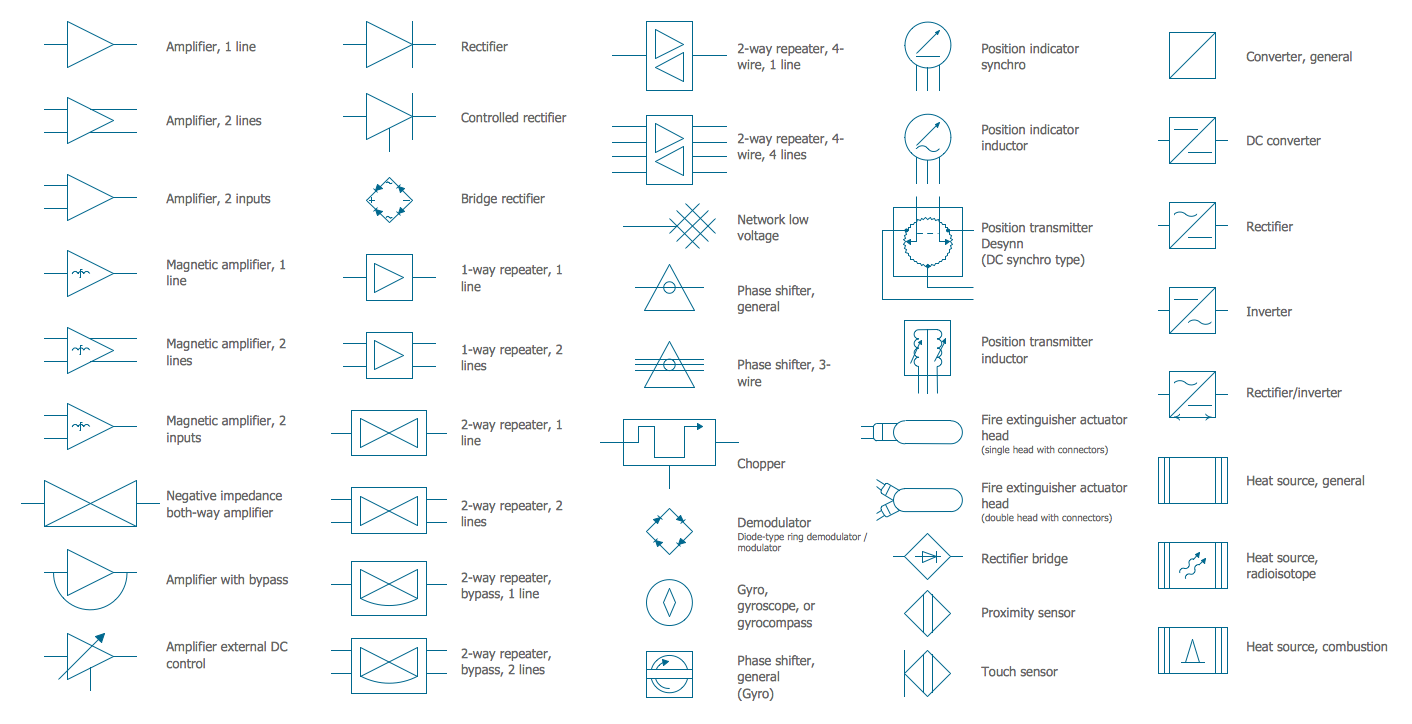
Picture: Electrical Symbols — Composite Assemblies
Related Solution:
The Affinity Diagram shows the structure of large, complex factors that have an influence on a problem, and then divides them up into a smaller and simpler structure. The Affinity Diagram does not show a causal relationship between the factors. This diagram is designed to prepare the data for further analysis of the cause-effect relationships.
Picture: Affinity Diagram
Related Solution:
In your work activity you need regularly draw the line graphs? And each time you ask yourself a question How to Draw a Line Graph easier and faster?. The desire to automate the line graphs drawing process led to the creation of Line Graphs solution from Graphs and Charts area of ConceptDraw Solution Park.
Picture: How to Draw a Line Graph
Related Solution:
ConceptDraw DIAGRAM is ideal for software designers and software developers who need to draw Booch OOD Diagrams.
Picture: Booch OOD Diagram
This sample shows the Booch OOD diagram of the environment. The Booch method (developed by Grady Booch) is an object modeling language and methodology used in software engineering.
This sample was created in ConceptDraw DIAGRAM diagramming and vector drawing software using the Rapid UML Solution from the Software Development area of ConceptDraw Solution Park.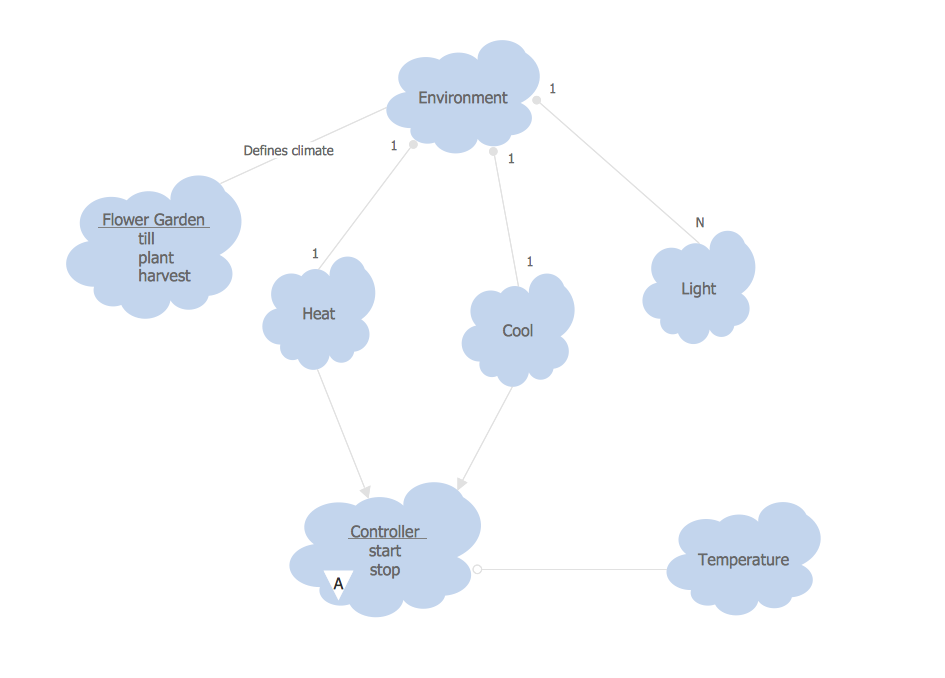
Picture: Object-Oriented Development (OOD) Method
Related Solution:

