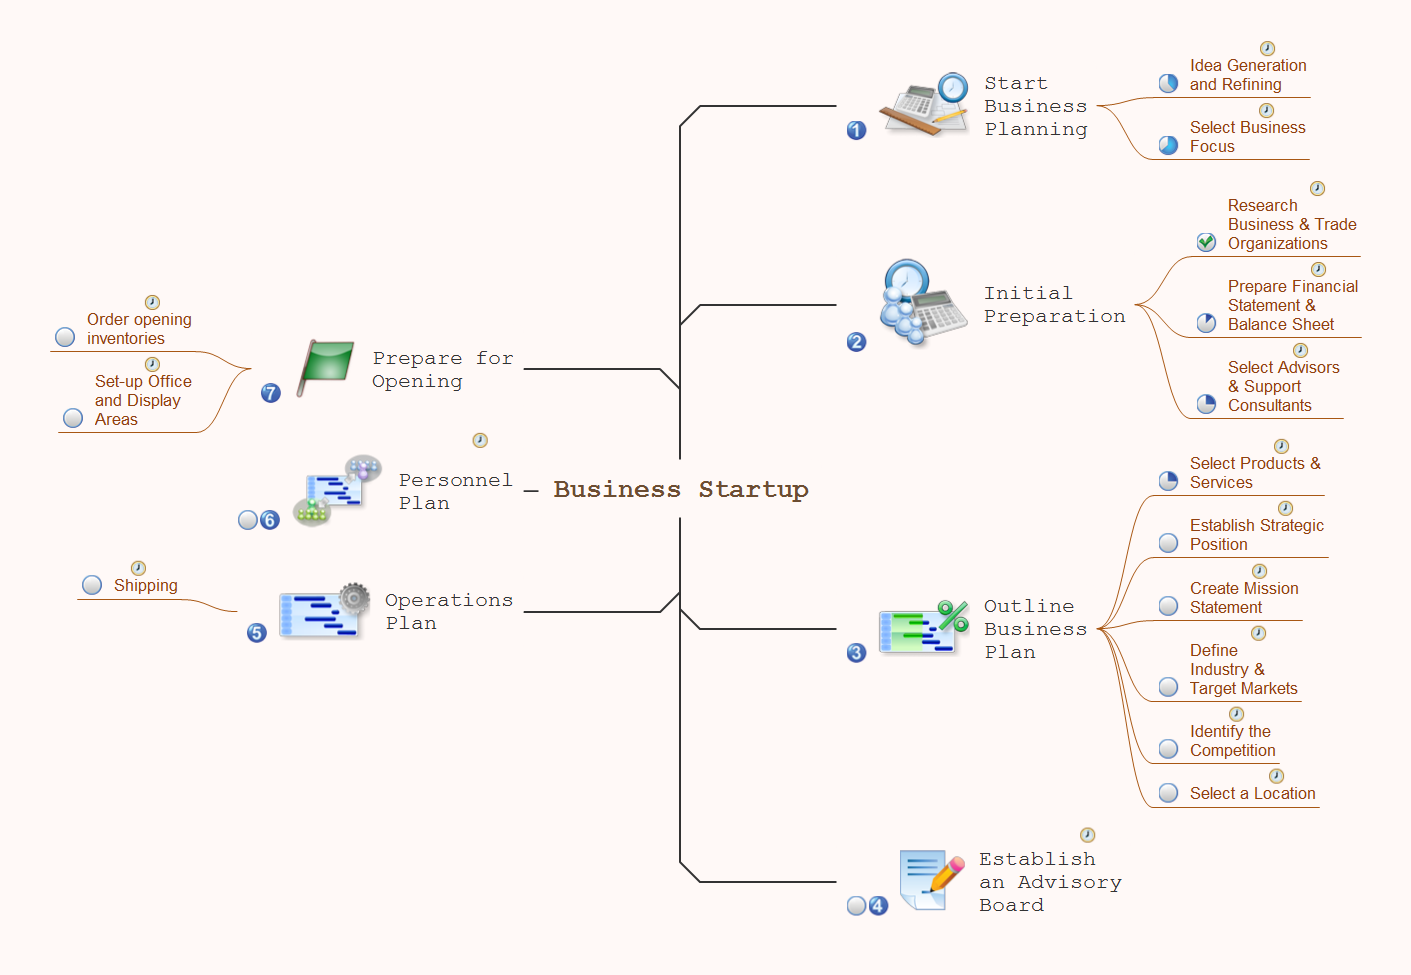
Sample 1. Business startup
This mindmap was created in ConceptDraw MINDMAP mind mapping software by experienced user for 30 minutes as a sample for solution Note Exchange from ConceptDraw Solution Park.
The Note Exchange solution extends ConceptDraw MINDMAP with the ability to exchange with Evernote, and access mind maps anywhere, on any computer or mobile device via Evernote.
Use ConceptDraw MINDMAP enhanced with Note Exchange solution as a strategic planner, sending strategic plans from your mind map to Evernote.
Using the Note Exchange solution you can upload a whole map, or specific parts relating to a certain objective, milestone or phase, and you can access your strategic mind maps wherever you are.
NINE RELATED HOW TO's:
When trying to figure out the nature of the problems occurring within a project, there are many ways to develop such understanding. One of the most common ways to document processes for further improvement is to draw a process flowchart, which depicts the activities of the process arranged in sequential order — this is business process management. ConceptDraw DIAGRAM is business process mapping software with impressive range of productivity features for business process management and classic project management. This business process management software is helpful for many purposes from different payment processes, or manufacturing processes to chemical processes. Business process mapping flowcharts helps clarify the actual workflow of different people engaged in the same process. This samples were made with ConceptDraw DIAGRAM — business process mapping software for flowcharting and used as classic visio alternative because its briefly named "visio for mac" and for windows, this sort of software named the business process management tools.
This flowchart diagram shows a process flow of project management. The diagram that is presented here depicts the project life cycle that is basic for the most of project management methods. Breaking a project into phases allows to track it in the proper manner. Through separation on phases, the total workflow of a project is divided into some foreseeable components, thus making it easier to follow the project status. A project life cycle commonly includes: initiation, definition, design, development and implementation phases. Distinguished method to show parallel and interdependent processes, as well as project life cycle relationships. A flowchart diagram is often used as visual guide to project. For instance, it used by marketing project management software for visualizing stages of marketing activities or as project management workflow tools. Created with ConceptDraw DIAGRAM — business process mapping software which is flowcharting visio alternative or shortly its visio for mac, this sort of software platform often named the business process management tools.
Picture: Process Flowchart: A Step-by-Step Comprehensive Guide
Related Solution:
To support you in your tasks you can use the power of ConceptDraw DIAGRAM providing
intelligent vector graphics that are useful for marketing diagramming and
ConceptDraw MINDMAP for key marketing mind maps.
Picture: Business Productivity - Marketing
Related Solution:
Collaboration software for small and medium business allows communicate with partners around the globe via Skype.
Picture: How to Collaborate in Business via Skype
Related Solution:
To launch Projects Exchanging Mind Maps with Evernote using ConceptDraw MINDMAP simply and easily.
Picture: Launch Projects Exchanging Mind Maps with Evernote
Related Solution:
But it never matters which hotel plan you want to illustrate in a way of a floor plan, you can always do it with ConceptDraw DIAGRAM especially it can be simple to do having the “Floor Plans” solution, which can be downloaded from the Building Plans area of ConceptDraw Solution Park.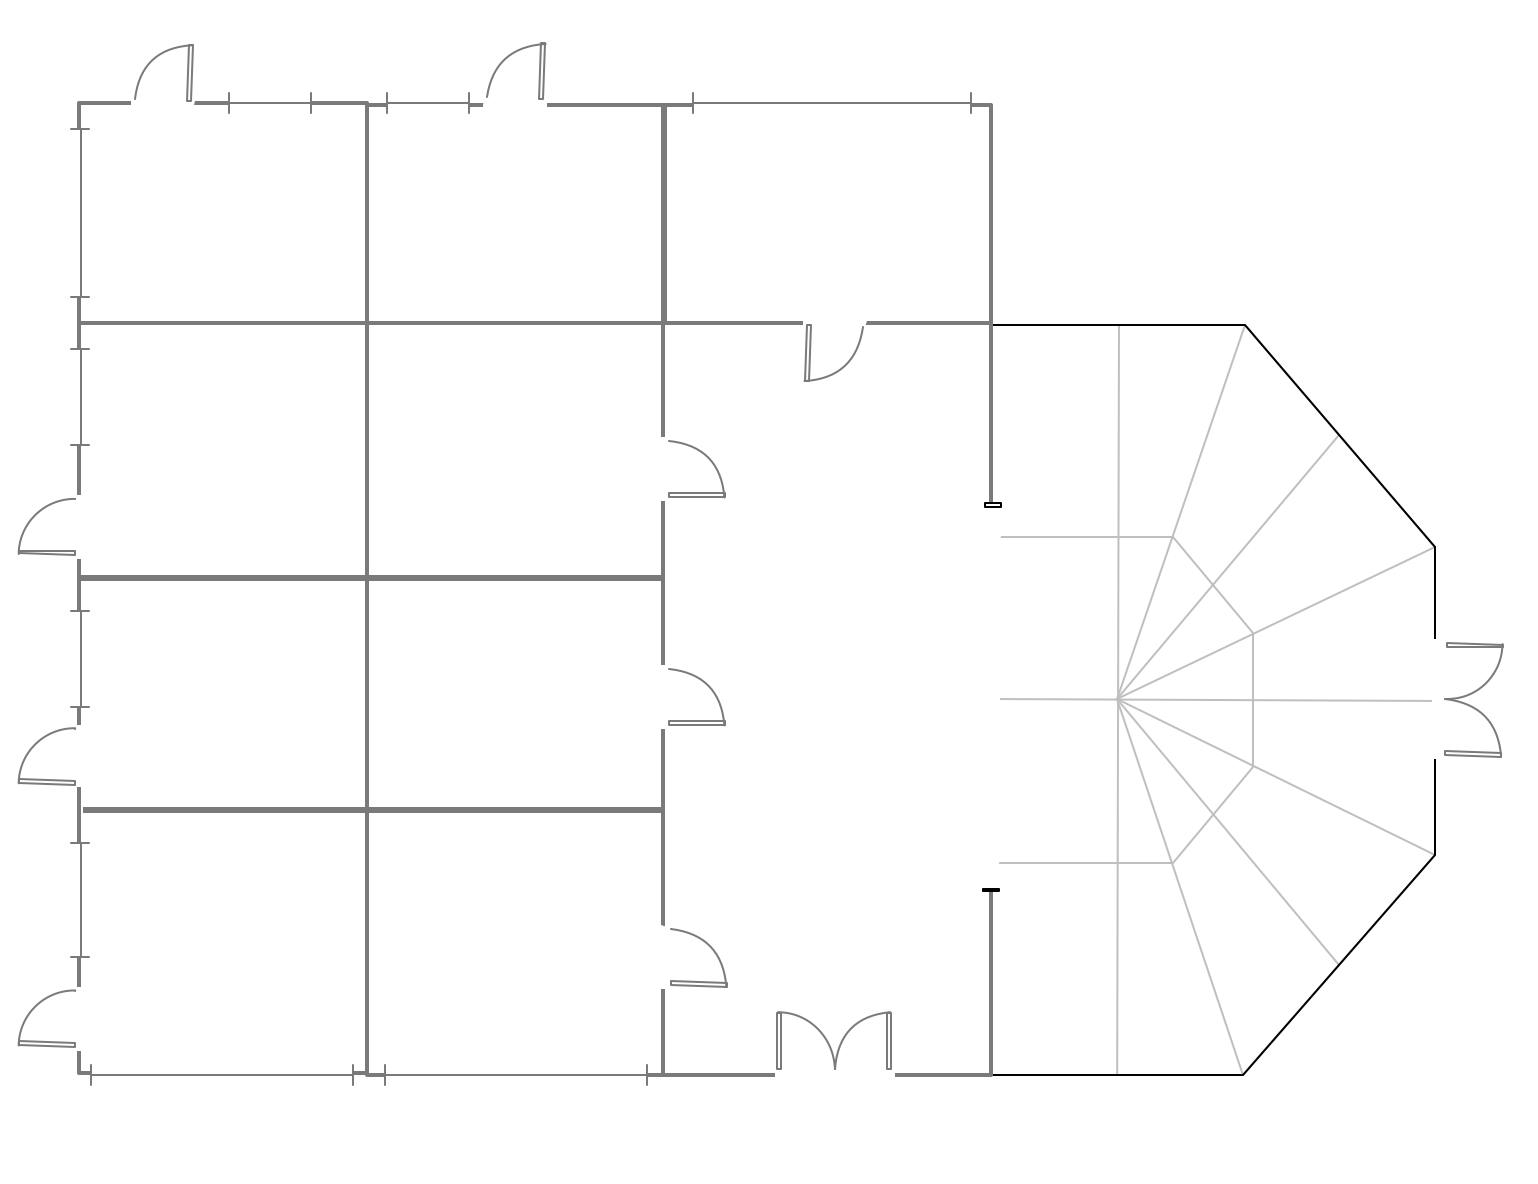
Picture: Mini Hotel Floor Plan. Floor Plan Examples
Related Solution:
ConceptDraw DIAGRAM is a business flowchart software includes the wide flowchart examples package.
Picture: Basic Flowchart Examples
Related Solution:
Mind map template of a strategy map that can help you display a variety of performance measures that can have an impact on your organization.
Picture: SWOT Analysis
Related Solution:
Germany, officially the Federal Republic of Germany, is a federal parliamentary republic in West-Central Europe. You need design the map of Germany or detailed map of Germany with cities fast and easy? We reccomend you to use the indispensable ConceptDraw DIAGRAM diagramming and vector drawing software extended with unique Germany Map Solution from the Maps Area of ConceptDraw Solution Park.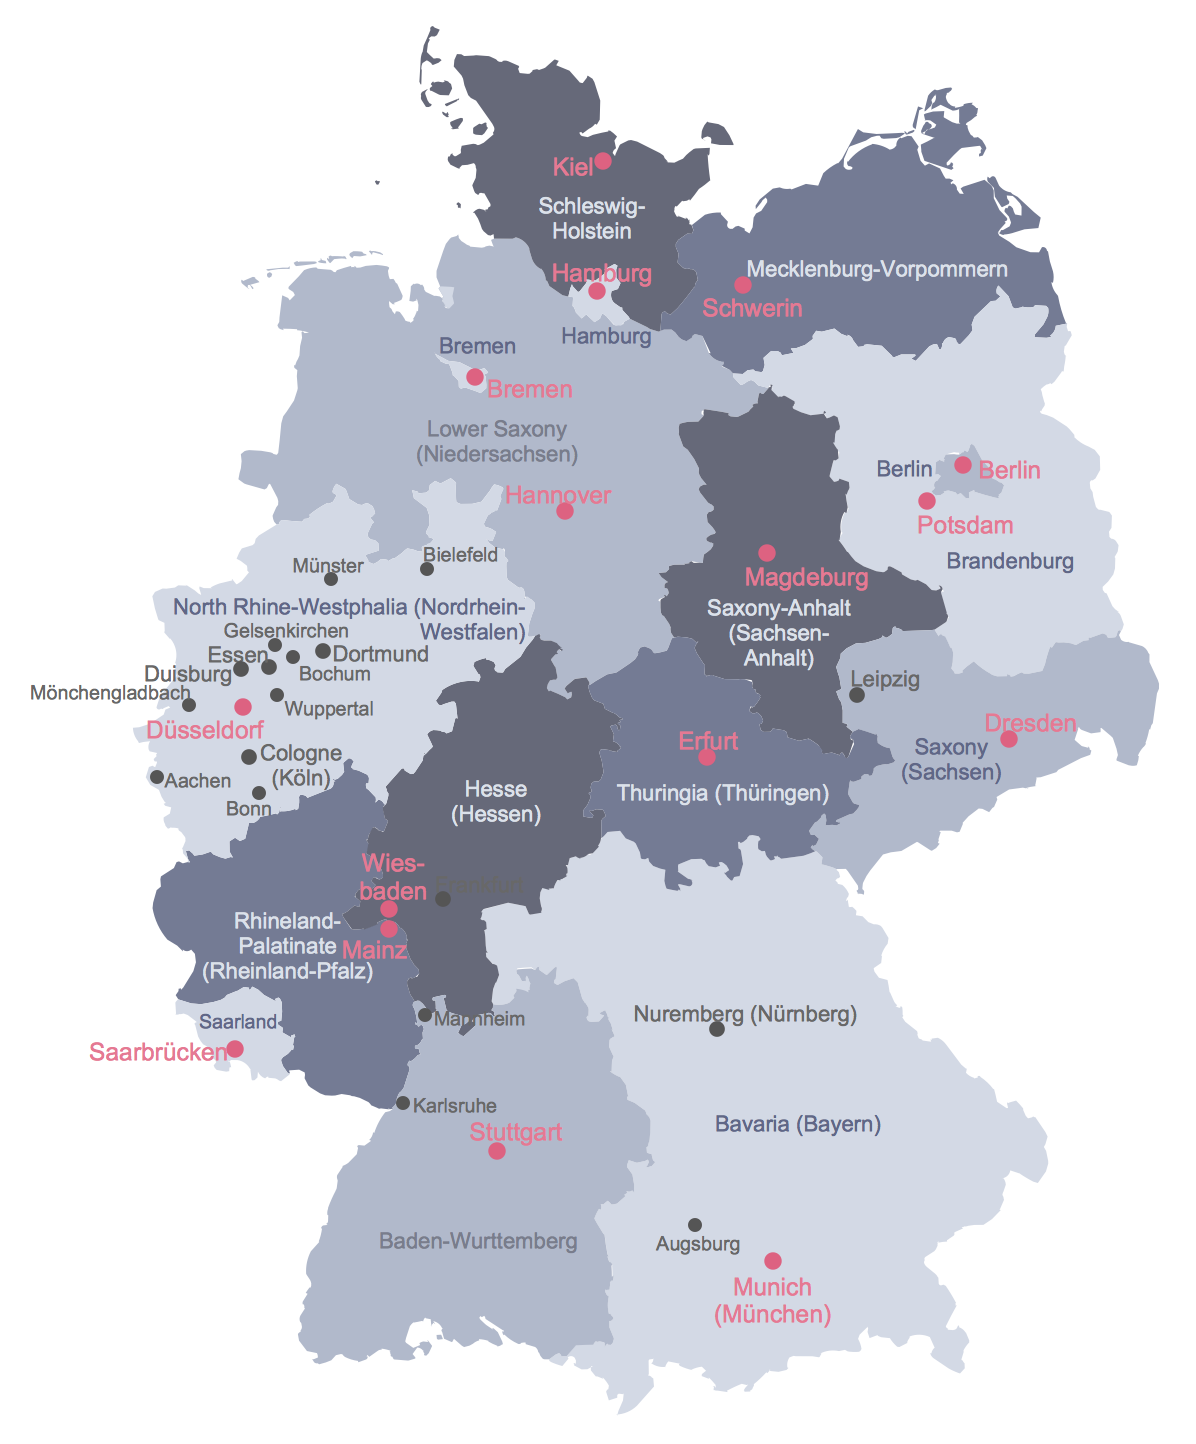
Picture: Map of Germany
Related Solution:
To build Strategies - powerful feature of ConceptDraw MINDMAP allows to combine the power of MINDMAP with the accessibility of the world’s favorite human memory platform, Evernote.Picture: Build Strategies Exchanging Mind Maps with Evernote
Related Solution: