
Sample 1. SWOT analysis matrix diagram - instructional sample.
SWOT analysis (SWOT Matrix) is a structured planning method used to evaluate the Strengths, Weaknesses, Opportunities, and Threats involved in a project or in a business venture. A SWOT analysis can be carried out for a product, place, industry or person. It involves specifying the objective of the business venture or project and identifying the internal and external factors that are favorable and unfavorable to achieving that objective. [SWOT analysis. Wikipedia]
See also:
Marketing — Matrices
- Marketing positioning matrix - Product positioning map
- Product-market matrix - Ansoff matrix
- BCG matrix - Boston growth-share matrix
- Feature comparison chart - Digital scouting cameras
- Marketing matrix diagram - Competitive strategies
- Marketing matrix diagram - Porters value chain
Marketing — Mind Maps
- Marketing mindmap - Marketing research project
- Marketing mind map - Strategic accomplishment mapping
- Twitter Compaign for New Software Product
- Marketing mind map - Sales Call
TEN RELATED HOW TO's:
SWOT matrix templates is part of SWOT Analysis solution from ConceptDraw Solution Park.
Picture: SWOT matrix template
SWOT matrix is a structured planning method used to evaluate the strengths, weaknesses, opportunities and threats involved in a project or in a business venture. ConceptDraw DIAGRAM diagramming and vector drawing software extended with SWOT and TOWS Matrix Diagrams Solution from the Management Area will help you design SWOT Matrix of any complexity quick and easy.
Picture: SWOT Matrix
Related Solution:
macOS is used increasingly often as a productivity platform by many companies and businesses across the world. SWOT Analysis is an essential business tool for companies to determine their future course of action. As a tool for digital drawing of SWOT Analysis diagrams under macOS, ConceptDraw offers Mac Tools - SWOT Analysis examples and templates are included to allow for effortless creation of SWOT and TOWS Analysis diagrams. With ConceptDraw it is equally easy to create your SWOT Analysis diagram under Microsoft Windows and macOS.
This image demonstrates the diversity of SWOT and TOWS matrix templates delivered with SWOT and TOWS Diagrams add-on for ConceptDraw DIAGRAM diagramming software. Together they compose a professional solution for performing SWOT and TOWS analysis. There are number of templates of different Matrix Diagrams. In addition to the set of embedded templates, this solution allows one to design SWOT and TOWS matrices tailored to certain business characteristics or corporate style. Using matrix template, you can easily discover Strengths, Weaknesses, Opportunities, and Threats, your business faced. This means that the first step to creating a successful business strategy, you have done.
Picture: Mac Tools - SWOT Analysis
Value stream mapping is a lean-management method for analyzing the current state and designing a future state for the series of events that take a product or service from its beginning through to the customer. ConceptDraw DIAGRAM diagramming and vector drawing software extended with Value Stream Mapping solution from the Quality area of ConceptDraw Solution Park is effective for implementation a value stream mapping (VSM) process and for creating Value Stream Maps.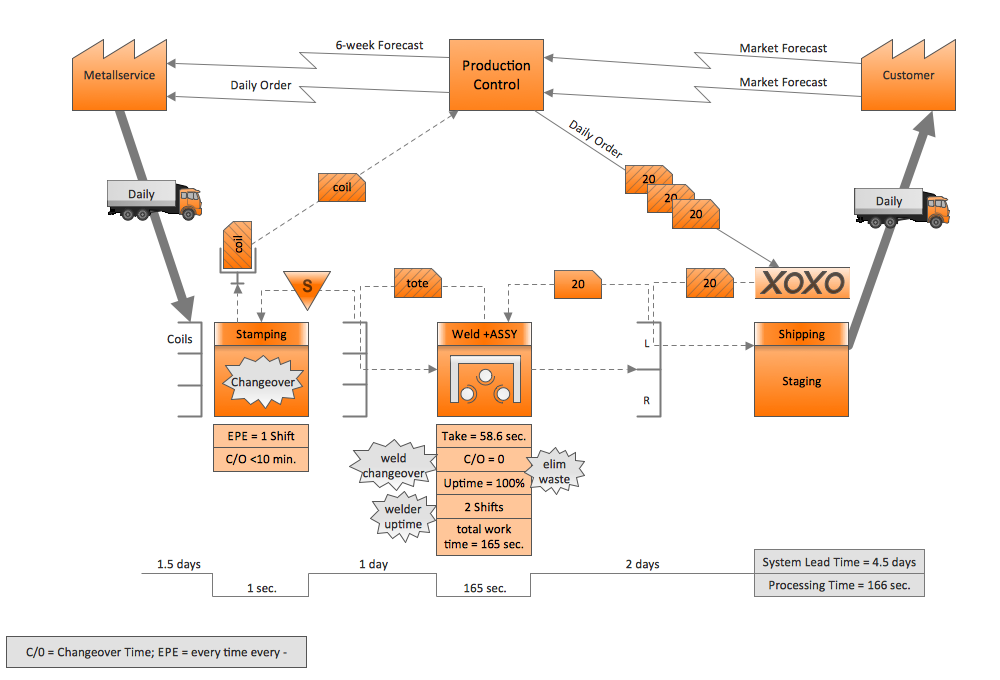
Picture: VSM
Related Solution:
ConceptDraw DIAGRAM extended with Matrices Solution from the Marketing Area of ConceptDraw Solution Park is a powerful software for drawing various types of Marketing Matrices: Ansoff Matrix, BCG Matrix, Deployment Chart, Feature Comparison Chart, Competitive Strategies Matrix, Flow Process Chart, Porter's Value Chain Diagram, Positioning Map, and many others.
Picture: Matrices
Related Solution:
If you have your own business, you shouldn’t be afraid to use different management techniques. It also should be mentioned that SWOT analysis tool for small business is just as useful as for an transatlantic corporation. If you want to see whether you company is able to compete on the market, SWOT analysis is a great solution.
The following drawing illustrates the simple template, created for providing SWOT analysis. You can use it for your management courses as a tutorial for SWOT analysis. The tips, added to each section of a matrix are intended to help you to fill them with the information of the strengths and weaknesses of your training case, and do not forget, at the same time, about opportunities and threats. This template is one of a set of templates of SWOT matrices that can be found in the the ConceptDraw SWOT and TOWS diagrams solution. This solution used as part of simple project management software in ConceptDraw Office as advertising agency software or marketing management software.
Picture: SWOT Analysis Tool for Small Business
This sample shows the Perceptual map. It was created in ConceptDraw DIAGRAM diagramming and vector drawing software using the Matrices Solution from the Marketing area of ConceptDraw Solution Park.
Perception Mapping helps organizations measure and transform all aspects of their business, people and culture. Perception Mapping allows to represent the complex relationships graphically, helps identify potential problems of the organization and make the best decisions.
Picture: Business Tools Perceptual Mapping
Related Solution:
SWOT Analysis solution extends ConceptDraw MINDMAP and ConceptDraw DIAGRAM products with easy-to-use SWOT Analysis tools.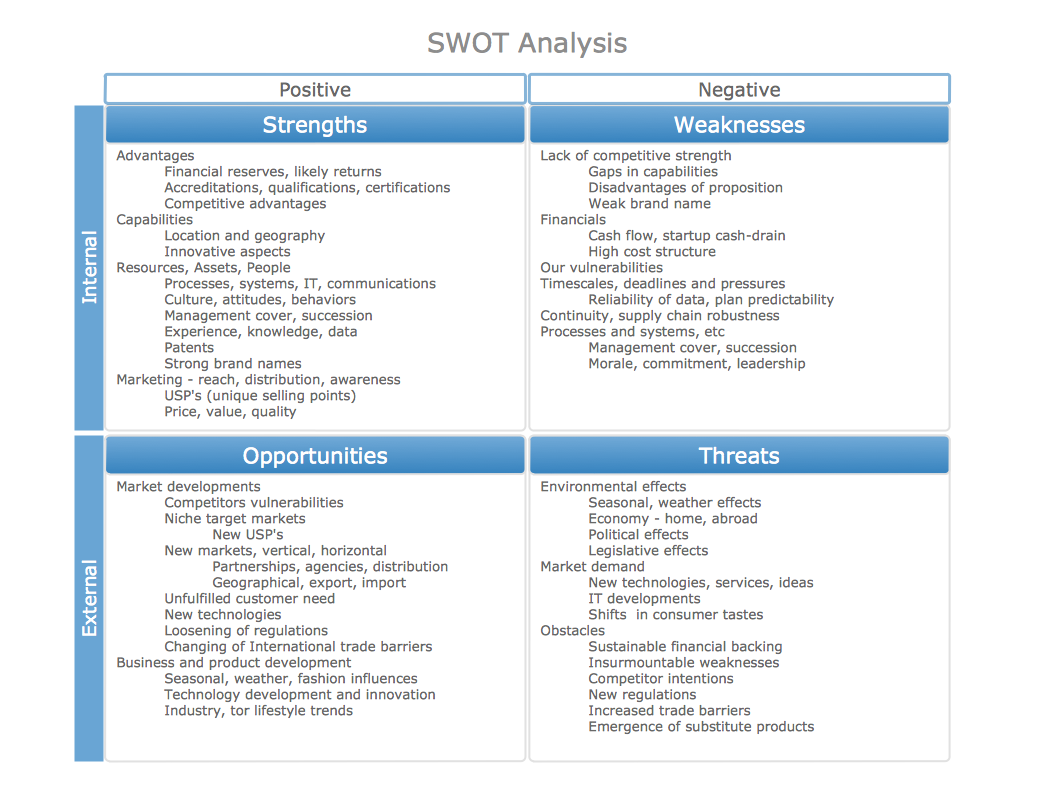
Picture: SWOT Analysis matrix templates and samples
Analysis is very important part for every business, as it helps to understand the weakness and to see the opportunities, and SWOT is one of the most effective tools. To illustrate the multifunctionality of this tool, let’s imagine a SWOT sample in area of computers networking, which can be carried out to realize the pros and cons of some equipment, for example. Even a network topology or a administer can be a subject for this analysis.
This SWOT analysis matrix illustrate the sample of using this useful technique for comprehension of Strengths and Weaknesses, and for determining the Opportunities open to business and the Threats it encounters. Used in a business scope, it will help to create a perspective niche in the market for particular business. The ConceptDraw SWOT and TOWS Analysis solution gives a lot of templates of both SWOT and TOWS matrices that allow managers and marketers create custom diagrams to perform SWOT or TOWS analysis in context of a particular business.
Picture: SWOT Sample in Computers
What is organizational charts and why your business need them? How to use business process diagram software? Explore how advanced organization chart software transforms the way companies ✔️ visualize, ✔️ communicate, and ✔️ streamline their organizational hierarchies
Picture:
What is an Organizational Chart and how it works?
Organization Chart Software
Related Solution: