KPI Dashboard
A “performance indicator” is also called as a “key performance indicator”, being one of the types of the performance measurements which evaluate the success of some particular organization or activity, such as programs, projects, products, etc., in which it is engaged in. Success is often known to be the periodic, repeated achievement of some levels of the operational goal, but sometimes it can be defined in terms of making the progress toward the strategic goals. Thus, it is always very important to choose the right KPI which relies on a good understanding of exactly is important for the particular organization, depending on the department measuring the performance. In order to understand what exactly is important, there are many techniques used for assessing the state of the business nowadays. The key activities of each of the business being evaluated, are usually associated with the choice of the existing and widely used performance indicators. Such assessment often leads to the identification of the potential improvements, making the performance indicators being routinely associated with the so called “performance improvement” initiatives. A very common way to choose the right key performance indicator is to apply a balanced scorecard or a dashboard, known to be often providing the particular views of the key performance indicators, which are relevant to a particular business process, such as sales, human resources, production, marketing, etc., or its goal.
"Dashboard" may be also called as a "report" or "progress report", being often displayed on a web page which is linked to a database allowing the report to be updated on a full time basis. Thus, a manufacturing dashboard may show the different numbers, which are all related to such term as ”productivity”: for example, a number of the failed quality inspections per hour or a number of the parts that are being manufactured. A human resources dashboard may be the one showing the numbers which are related to the process of the staff recruitment, composition and retention, mentioning the number of the average days, the open positions, the cost per recruitment, etc.
There are also digital dashboards which are quite important for allowing the managers to monitor the existing contribution of different departments within the organization they work for. To evaluate how well some particular organization is performing, such digital dashboards allow the managers of the mentioned organizations to capture and so to report the specific data points from each of the departments within the organization in a way of providing a "snapshot" of the performance.
The well-known benefits of using the described digital dashboards include the ability to identify and so to correct all the existing negative trends, to visually represent the performance measures, to measure the efficiency as well as an inefficiency, the ability to generate the detailed reports in a way of showing the new trends as well as the ability to make more of the informed decisions, most of them are usually based on the so called “collected business intelligence”. It is also possible to align all the existing strategies as well as the organizational goals and to save time by using the described digital dashboards instead of running multiple reports. The digital dashboards also allow to gain the total visibility of all the existing systems straight away at the same time allowing the quick identification of any existing data outliers as well as the correlations.
It is always possible to “break down” the existing dashboards depending on their role, which may be either analytical, operational, informational or strategic. The strategic dashboards support those managers who are in charge for making it possible for any organization to succeed, using the key performance indicators for evaluating the existing problems. It can be done at any of the existing levels in a particular organization by providing a quick overview which those decision makers need to monitor, getting to know both the current state as well as the opportunities of their business.
The “strategic dashboards” are known to be focusing on the high level measures of performance, as well as on the forecasts. They benefit from the so called “static snapshots of data”, which can be quarterly, monthly, weekly or daily, being not changing all the time from one moment to the next one. Those dashboards which are used for the analytical purposes are known to be including more context, history and comparisons to compare them with the subtler performance evaluators. The analytical dashboards are known to be supporting the interactions with the gathered data. Those dashboards which are used for monitoring operations often designed slightly differently from the data or strategic decision making analysis, requiring the monitoring of the activities as well as events which are constantly changing requiring enough response and attention at the first notice.
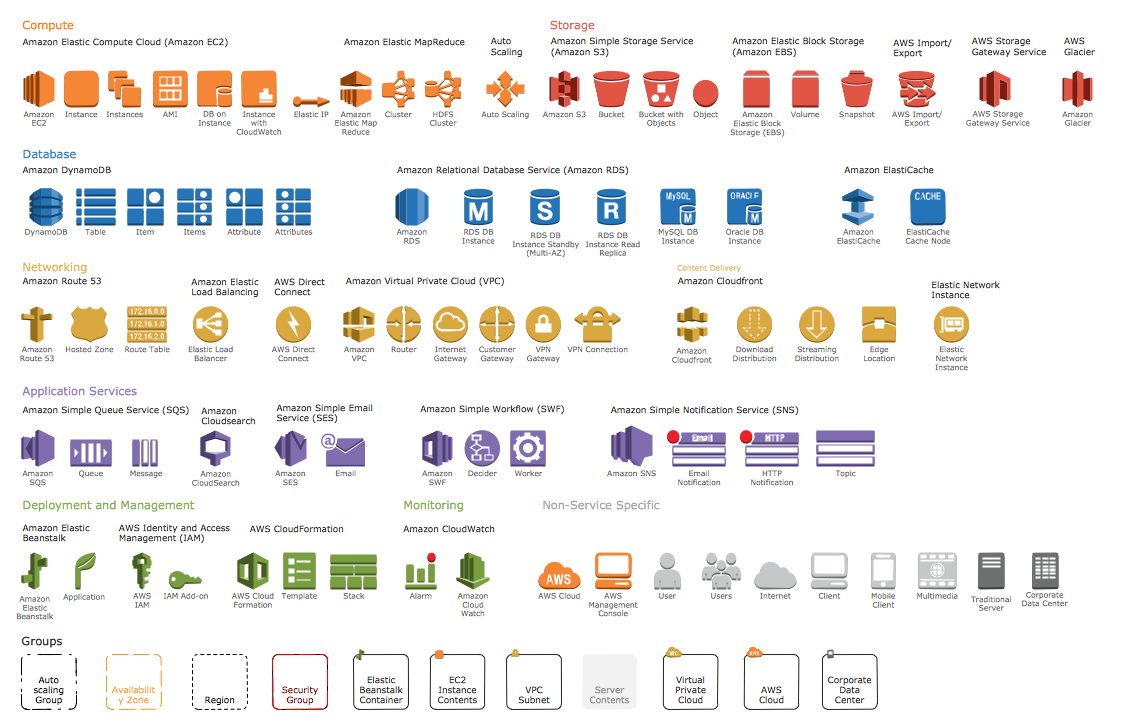
There are three main types of the existing digital dashboards, which are so called “stand alone” software applications, “desktop applications” (also known as the “desktop widgets”), driven by a so called “widget engine”, and the “web-browser based” applications. The specialized dashboards are able to track all of the existing corporate functions, such as human resources, recruiting, operations, security, sales, information technology, customer relationship management, project management as well as other departmental dashboards. There is a compact “startup scorecard dashboard” used within the smaller (startup) organization tracking all the most important activities across a lot of domains, which are ranging from the social media all the way up to sales.
Having ConceptDraw DIAGRAM software means enabling yourself to create a great looking as well as smart and professionally looking Sales Dashboards using the Sales Dashboard solution, available for all the ConceptDraw DIAGRAM users to be downloaded from ConceptDraw STORE application.

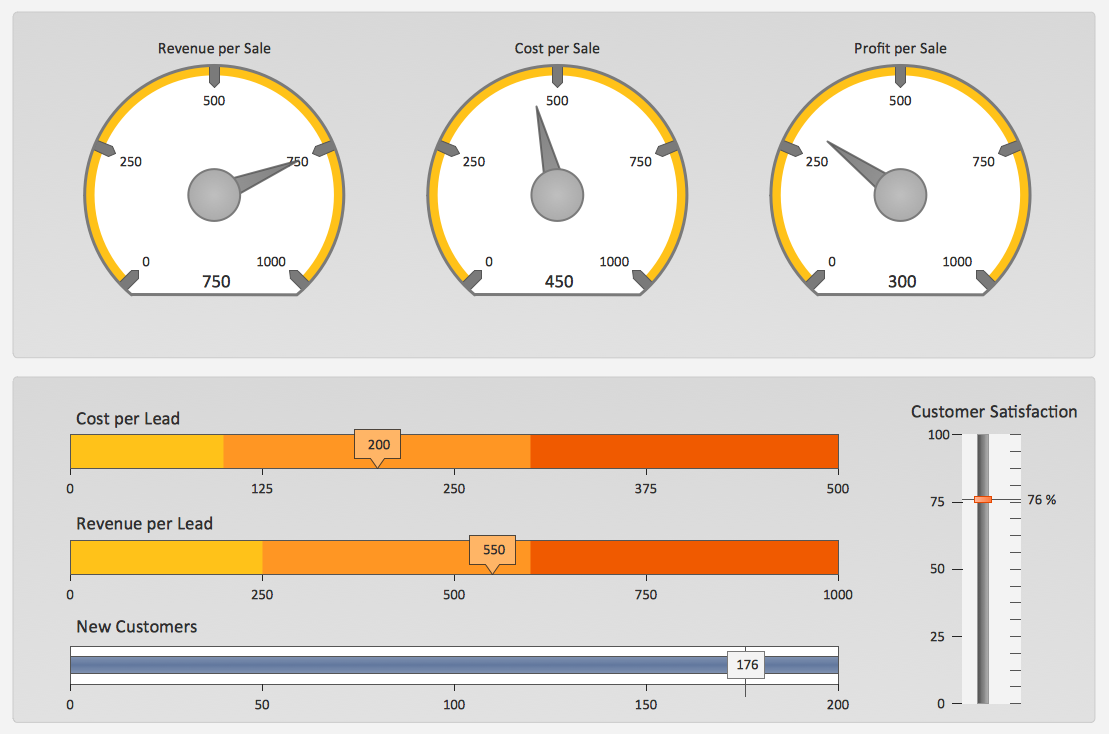
Example 1. KPI Dashboard
Among the useful tools offered by Sales Dashboard Solution we want first of all mark 2 libraries with numerous ready-to-use vector live objects:
- Sales Dashboard Library
- Sales KPIs and Metrics Library

Example 2. Sales Dashboard Solution in ConceptDraw STORE
Sales Dashboard Solution contains also variety of dashboard samples and templates, and data source files for creating the KPI Dashboard of any complexity without efforts. All they are available for ConceptDraw DIAGRAM users from ConceptDraw STORE.

Example 3. Sales Manager Dashboard
The KPI Dashboard samples you see on this page were created in ConceptDraw DIAGRAM using the Sales Dashboard Solution for ConceptDraw DIAGRAM Solution Park. They successfully demonstrate solution's capabilities and professional results you can achieve. An experienced user spent 10 minutes creating every of these samples.
Use the Sales Dashboard Solution for ConceptDraw DIAGRAM software to create your own professional looking live KPI Dashboard quick, easy and effective, and then successfully use it in your work activity.
All source documents are vector graphic documents. They are available for reviewing, modifying, or converting to a variety of formats (PDF file, MS PowerPoint, MS Visio, and many other graphic formats) from the ConceptDraw STORE. The Sales Dashboard Solution is available for all ConceptDraw DIAGRAM or later users.