What is a KPI?
What is a KPI? There are two groups of performance measures of work of an organization: result indicators and performance indicators. Key performance indicators (KPIs) represent a set of measures that are focused on the aspects of organizational performance which are the most important for its current and future success.
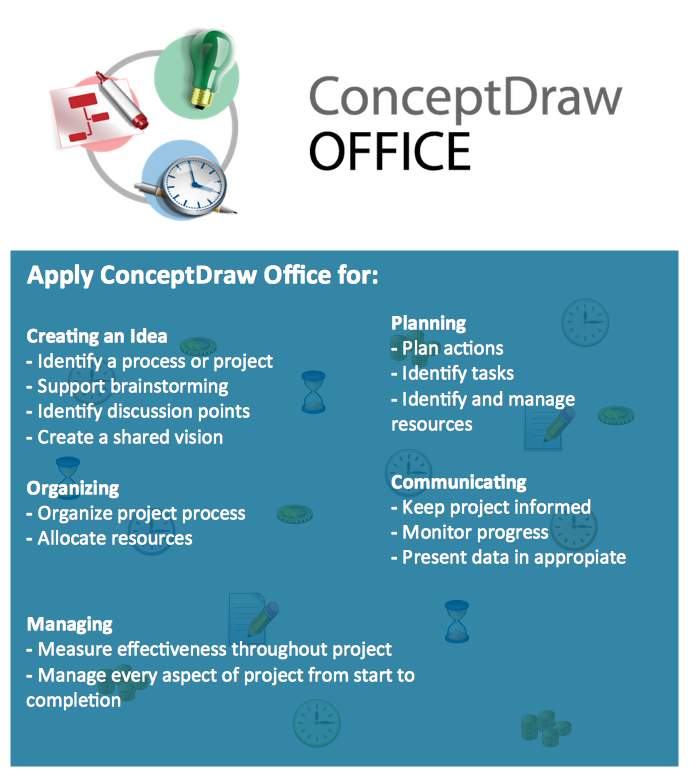
ConceptDraw DIAGRAM diagramming and vector drawing software enhanced with Sales Dashboard solution from the Marketing area of ConceptDraw Solution Park allows effectively develop, analyze and improve your business thanks to the excellent possibility of monitoring all KPIs on one screen in a real time.
Example 1. What is a KPI?
Good KPI Dashboard sample is the best answer for the question "What is a KPI?". Sales Dashboard Solution provides large number of good professional looking samples, templates, examples of data source files specially developed for ConceptDraw DIAGRAM users. You can find them all in ConceptDraw STORE and use in the process of creating your own dashboards.

Example 2. Sales Dashboard Solution in ConceptDraw STORE
If you decided to create your dashboard from the beginning at the new blank ConceptDraw document, the ready-to-use live objects from Sales Dashboard library and Sales KPIs and Metrics library of Sales Dashboard Solution will be very helpful for you.

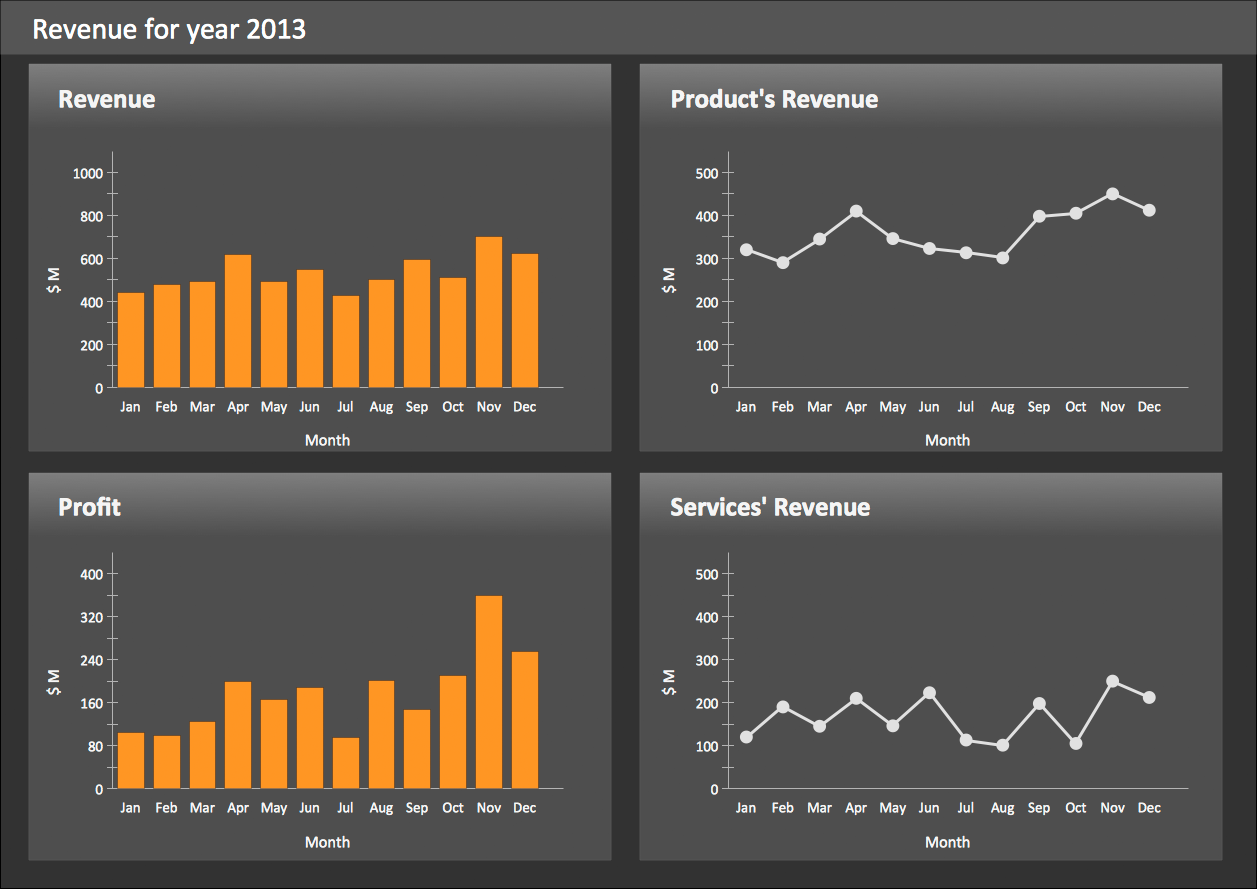
Example 3. Sales Performance Dashboard
This sample was created in ConceptDraw DIAGRAM software using the tools of the Sales Dashboard Solution and visually shows the effectiveness of an organization’s activities with help of various dashboards. This is a good example explaining what is a KPI. An experienced user spent 15 minutes creating this sample.
Use the Sales Dashboard Solution for effective business improving and creating your own professional looking Sales KPI Dashboards.
All source documents are vector graphic documents. They are available for reviewing, modifying, or converting to a variety of formats (PDF file, MS PowerPoint, MS Visio, and many other graphic formats) from the ConceptDraw STORE. The Sales Dashboard Solution is available for all ConceptDraw DIAGRAM or later users.