Relations Diagram
Relations DiagramIdentify how factors influence each other. Factors mostly influencing called “Drivers” Primarily affected factors called “Indicators”. Problem solving further focuses on changing driver factors by corrective actions. Indicator factors help establish KPI (Key Performance Indicators) to monitor changes and the effectiveness of corrective actions in resolving a problem. How to create Relations Diagram
Identify what factors are causes and which factors are effects. |
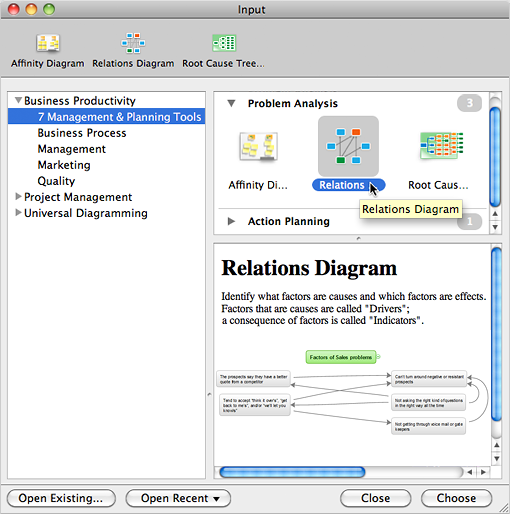
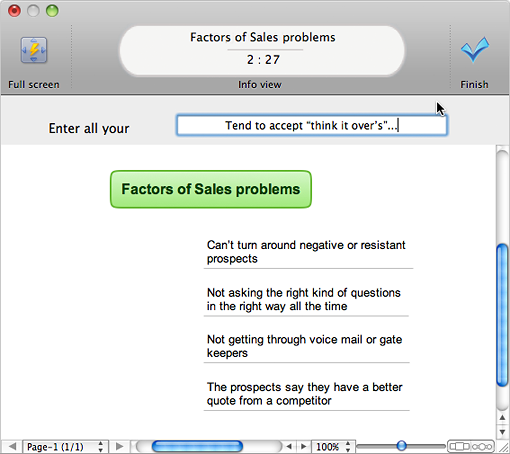
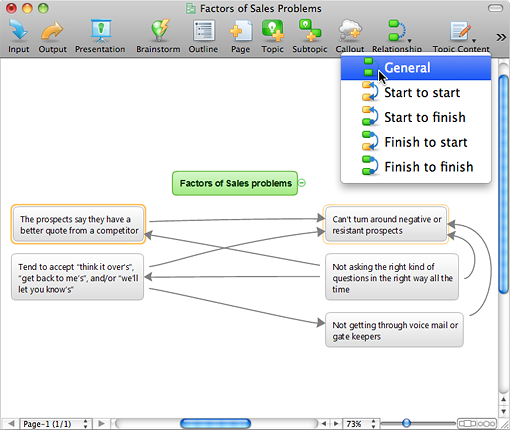
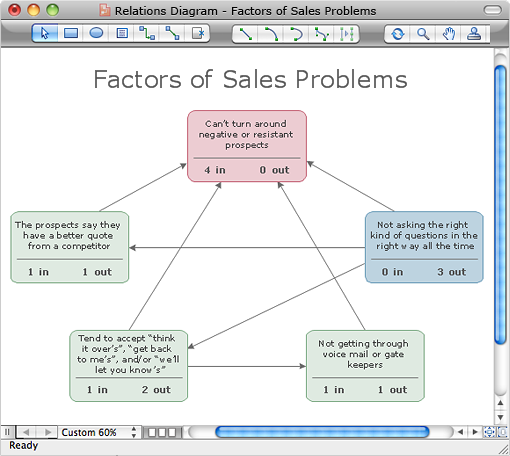

Example 1. Factors of Sales Problems
The Benefits for ConceptDraw MINDMAP Brainstorming Software
- ConceptDraw MINDMAP is effective for brainstorming, designing mind maps, idea generating, creative and lateral thinking, creativity and problem solving.
- ConceptDraw MINDMAP is ideal for team and personal work in Business, Marketing and Project Management.
- The libraries with large quantity of vector objects help to illustrate your mind maps and to make them bright, visual and comprehensible.
- Use of View Navigator tool lets create presentations from a mind map: you can simply select the map parts you want to present, sequence your slides, and preview the presentation.
- ConceptDraw MINDMAP provides wide capabilities of importing and exporting in various formats: Microsoft PowerPoint, Microsoft Word, MS Excel, Mindjet MindManager, image, HTML, PDF file.
TEN RELATED HOW TO's:
ConceptDraw DIAGRAM diagramming and vector drawing software supplied with Sales Dashboard solution provides the full set of useful tools which make it the best for producing the live KPI Dashboard of any complexity.
Picture: KPI Dashboard
Related Solution:
The affinity diagram is a business tool used to organize ideas and data. It is one of the Seven Management and Planning Tools. But how design the Affinity Diagram quick and easy? ConceptDraw DIAGRAM diagramming and vector drawing software offers the Seven Management and Planning Tools Solution from the Management Area.
Picture: Affinity Diagram
Related Solution:
MindMap Presentation via Skype, brainstorming and organizing ideas. Create and present Mind Maps using software.
The presentation via Skype conference call is part of solution Remote Presentation for Skype - from ConceptDraw Solution Park. It let presenter to control over the slide-show process which plays on each computer of conference call participants synchronously.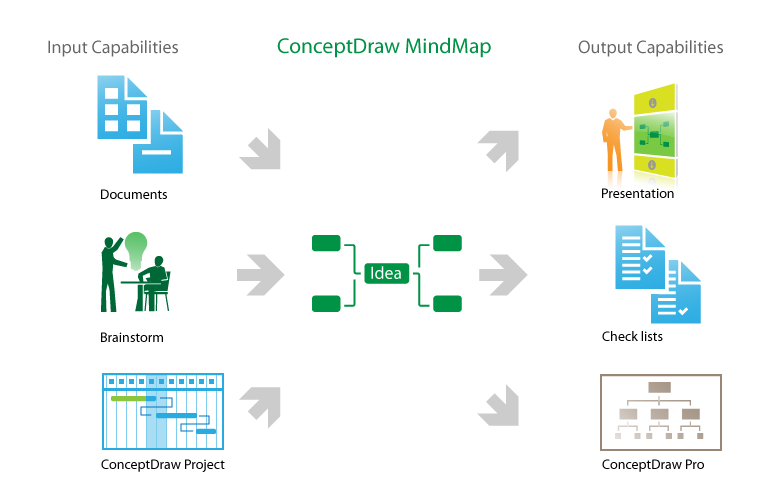
Picture: How to make great presentation via Skype? ...how it works with ConceptDraw MINDMAP?
Related Solution:
A waterfall model describes software development process as a sequence of phases that flow downwards. SSADM is one of the implementations of waterfall method. It’s easier to learn about structured systems analysis and design method (SSADM) with ConceptDraw DIAGRAM because this software has appropriate tools for creating data flow diagrams. You can use all the three main techniques of SSADM method with special tools and predesigned templates.
This data flow diagram illustrates the Structured Systems Analysis and Design Method. This method method considers analysis, projecting and documenting of information systems. Data flow models are the most important elements of SSADM and data flow diagrams are usually used for their description. It includes the analysis and description of a system as well as visualization of possible issues.
Picture: Structured Systems Analysis and Design Method. SSADM with ConceptDraw DIAGRAM
Related Solution:
Database design is an important part of any project, as databases become more and more complex nowadays. To make the model more representative, entity relationship diagrams are widely used in software engineering area. These diagrams show sets of entities as rectangles connected via lines labeled with their cardinalities.
This an example of the ER-diagram developed to store information regarding some online role-playing game. It includes three main elements of ER diagram: entities, relationships and attributes. The entities, attributes and relationships on this ER-diagram is depicted according to the Chen's notation. Chen's notation for Entity Relationship diagrams admits using of rectangles to depict entities, ovals for attributes and ,at least, diamonds to show relationships. ConceptDraw Entity-Relationship Diagrams solution was applied as ERD software to create this diagram.
Picture: ConceptDraw DIAGRAM ER Diagram Tool
Related Solution:
You need to draw Authority Matrix Diagram quick and easy? Design it with ConceptDraw DIAGRAM!
ConceptDraw DIAGRAM extended with Seven Management and Planning Tools solution from the Management Area is the best Authority Matrix Diagram Software.
Picture: Authority Matrix Diagram Software
Related Solution:
The Involvement Matrix can identify the distribution of responsibilities and identify roles in a group or team. Use the Involvement Matrix to specify roles and responsibilities of actions in problem solving.
ConceptDraw Office suite is a software for corrective actions planning.
Picture: CORRECTIVE ACTIONS PLANNING. Involvement Matrix
ConceptDraw DIAGRAM extended with the Rapid UML solution is perfect for drawing professional UML diagrams.
Picture: How to create a UML Diagram
Related Solution:
6 sigma →
This mind map shows how Six Sigma methodology be represented as a mind map. Six Sigma is a quality management methodology allows reducing the number of defects to 3.4 defects per million.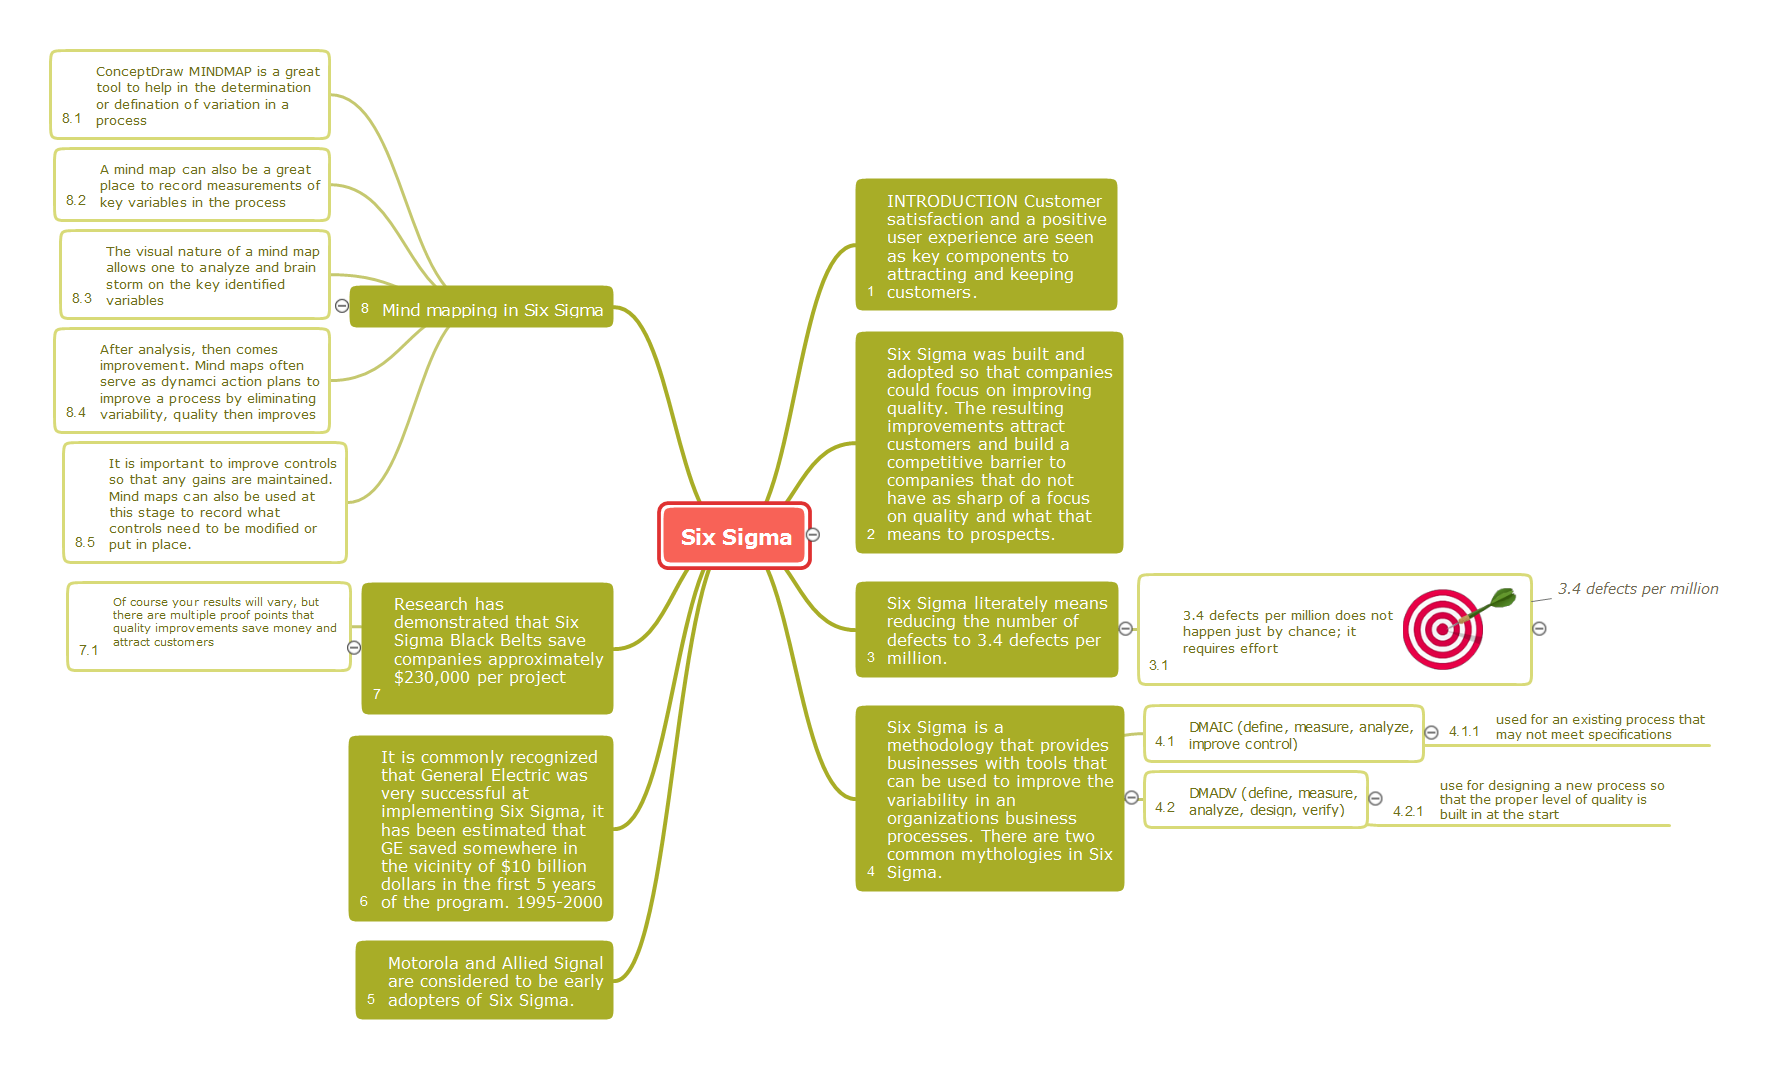
Picture: 6 sigma
Related Solution:
In almost every sphere of life and work the people time to time are faced with the fact that on their way there are certain obstacles and problems. But it is not always possible to identify the true cause of particular problem. To understand the basic causes of problems and eliminate them, it is convenient to use the chart of Kaoru Ishikawa - the technique specially designed for this.
ConceptDraw DIAGRAM diagramming and vector drawing software extended with Fishbone Diagrams solution from the Management area can help you with construction the Fishbone Diagram also known as Ishikawa Diagram.
Ishikawa Diagram shows factors of Equipment, Process, People, Materials, Environment and Management, all affecting the overall problem in one drawing for the further analysis. It is a well effective way to analyze the business problems you must identify and solve.
Picture: Ishikawa Diagram
Related Solution:
ConceptDraw
MINDMAP 16