Value Stream Management
The new Value Stream Mapping solution found in the ConceptDraw Solution Park continues to extend the range of ConceptDraw DIAGRAM into a business graphics tool that can be used to document processes in any organization. Value Stream Maps visualize for a manufacturing plant the material and information flow required to deliver a product/service to customers.

Pic.1 VSM diagram.
This sample VSM flowchart shows the value stream in a manufacturing management, production control and shipping processes.
See also Samples:
TEN RELATED HOW TO's:
This sample shows the Flowchart for determine is a species heterotroph or autotroph, or a subtype. This diagram has start point and end points. The diamonds on the Flowchart represent the decisions. The Flowcharts are widely used in science, analytics, government, politics, business, engineering, architecture, marketing, manufacturing, administration, etc.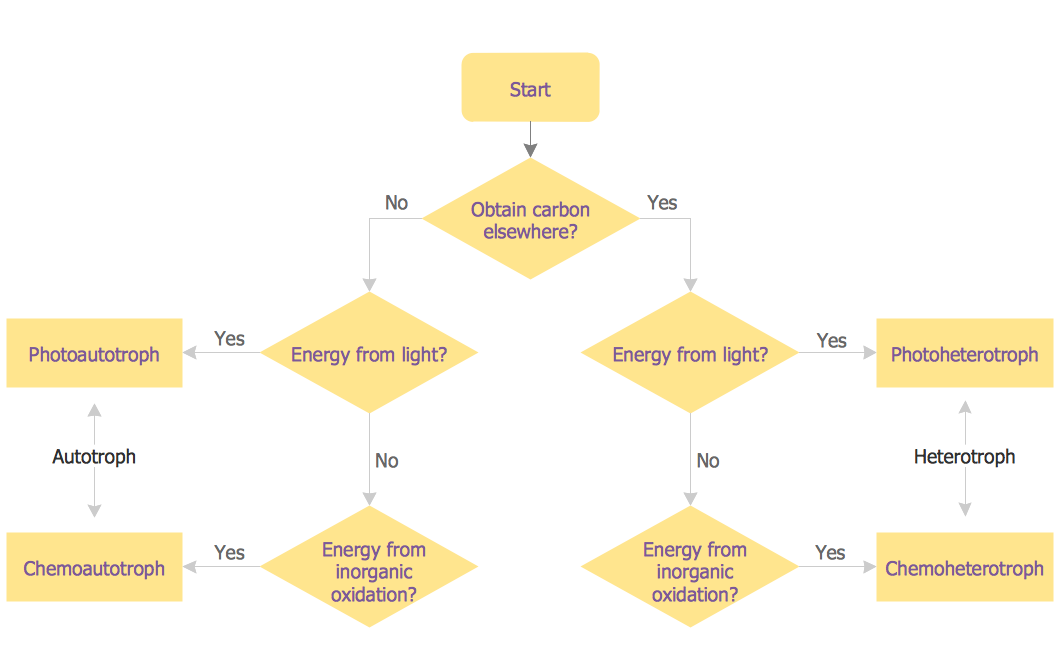
Picture: Samples of Flowcharting
Related Solution:
The Value Stream Mapping solution from ConceptDraw Solution Park extends ConceptDraw DIAGRAM software with a new library that contains vector objects, samples and templates.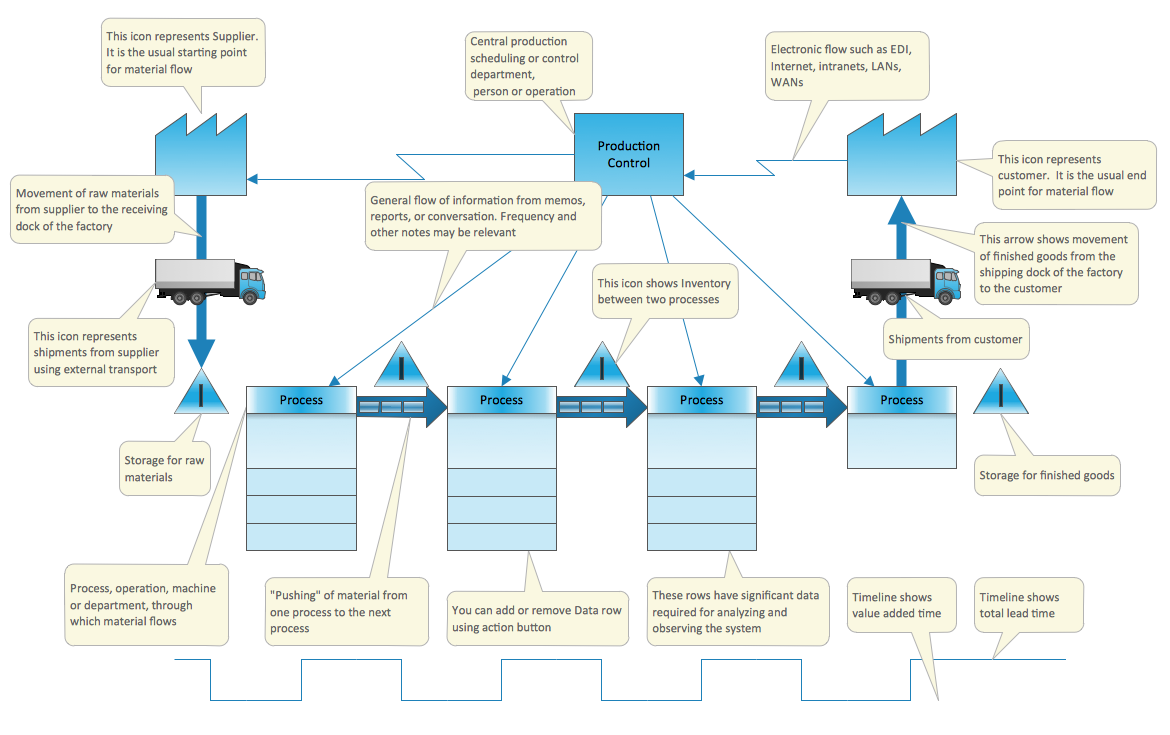
Picture: Create a Value Stream Map Rapidly
Related Solution:
When you need a drawing software to create a professional looking cross-functional charts, ConceptDraw with its Arrows10 Technology - is more than enough versatility to draw any type of diagram with any degree of complexity.
Use templates with process maps, diagrams, charts to get the drawing in minutes.
Picture: Cross-Functional Process Map Template
Do you need to draw a check order process flowchart?
Use the intuitive product - ConceptDraw.
Picture: Check Order Process Flowchart. Flowchart Examples
Related Solution:
If you want to find a way to understand complex things in minutes, you should try to visualize data. One of the most useful tool for this is creating a flowchart, which is a diagram representing stages of some process in sequential order. There are so many possible uses of flowcharts and you can find tons of flow charts examples and predesigned templates on the Internet. Warehouse flowchart is often used for describing workflow and business process mapping. Using your imagination, you can simplify your job or daily routine with flowcharts.
Warehouse flowcharts are used to document product and information flow between sources of supply and consumers. The flowchart provides the staged guidance on how to manage each aspect of warehousing and describes such aspects as receiving of supplies; control of quality; shipment and storage and corresponding document flow. Warehouse flowchart, being actual is a good source of information. It indicates the stepwise way to complete the warehouse and inventory management process flow. Also it can be very useful for an inventory and audit procedures.
Picture: Flow Chart Example: Warehouse Flowchart
Related Solution:
The Value Stream Mapping solution extends ConceptDraw DIAGRAM software with a new library that contain vector objects, samples and templates.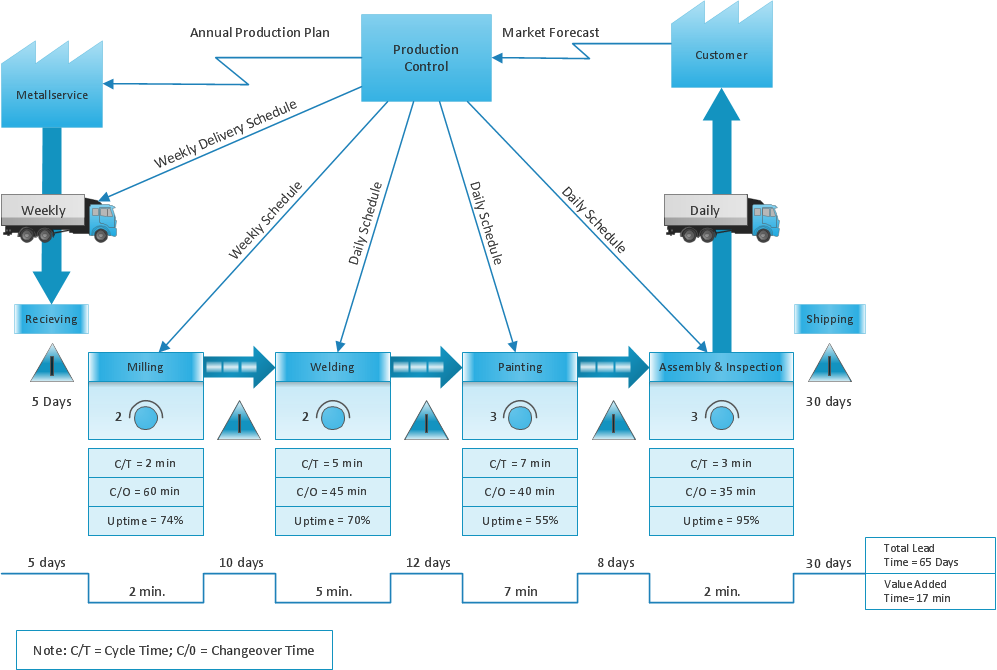
Picture: Sections of the Value Stream Map
Related Solution:
Create value stream maps - for value stream analysis and value stream management, material and information flow mapping, using our quick start templates included with ConceptDraw.
Picture: Value-Stream Mapping for Manufacturing
Related Solution:
Make sure that your purchasing process complies with the standards and regulations. Common key elements of purchasing process.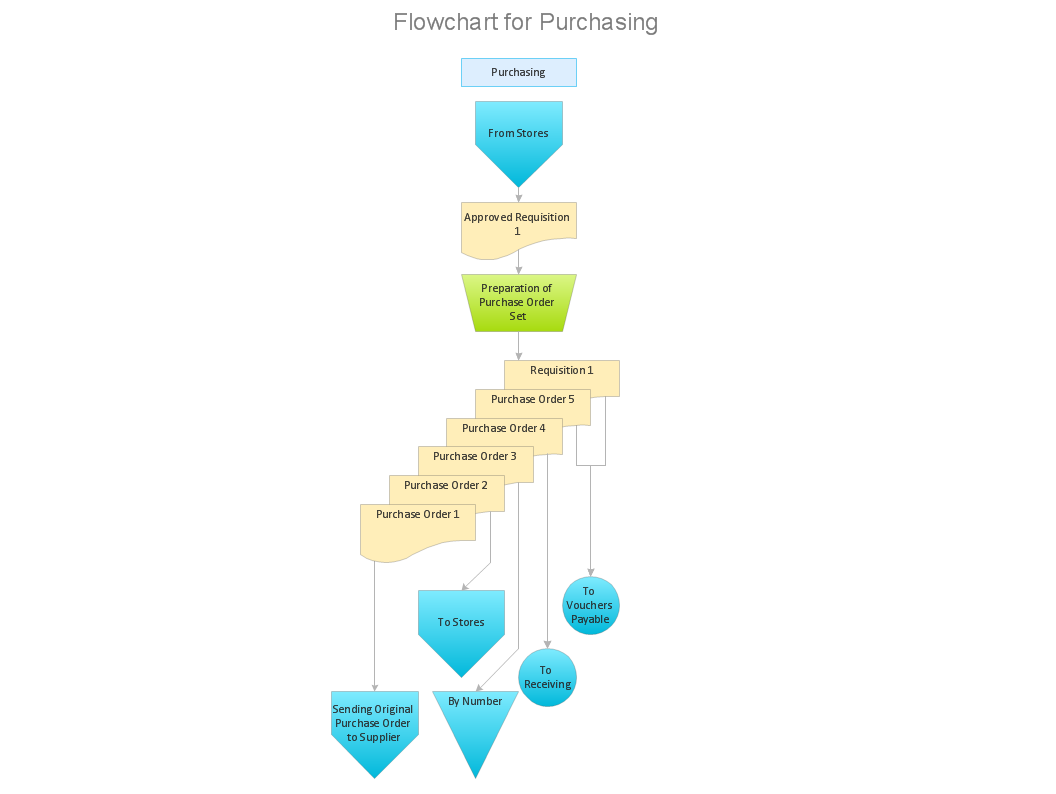
Picture: What can go wrong if the purchasing process is not followed?
Related Solution:
ConceptDraw Value Stream Mapping solution extends software with templates, samples and vector shapes for drawing Value Stream Maps (VSM).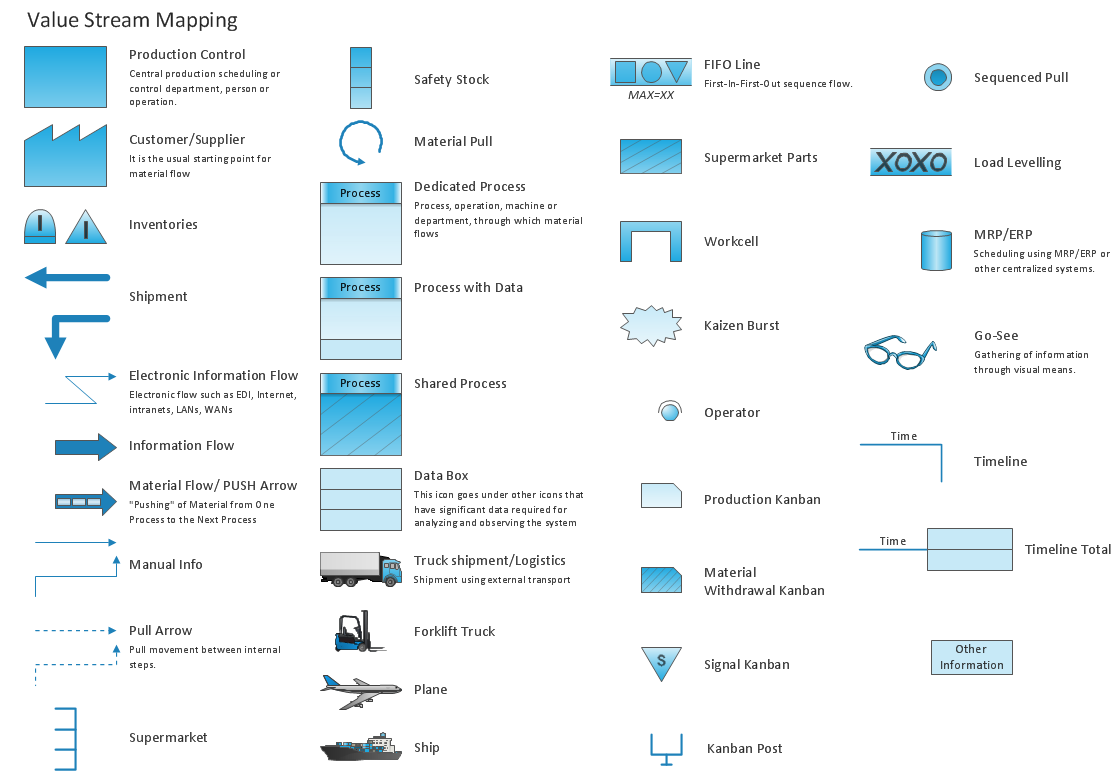
Picture: Standard Shapes for Value Stream Mapping
Related Solution:
ConceptDraw OFFICE suite is a software for Prioritization Matrix diagram making. This diagram ranks the drivers’ factors to determine priority. It identifies the factors of the first priority for analysis of possible corrective actions. It assesses the weight of each factor for each criterion and specifies it in the Prioritization Matrix. The total sum of weights for a factor’s criteria indicates its priority.
Picture: PROBLEM ANALYSIS. Prioritization Matrix
ConceptDraw
MINDMAP 16