Standard Shapes
for Value Stream Mapping
The new Value Stream Mapping solution found in the ConceptDraw Solution Park continues to extend the range of ConceptDraw DIAGRAM. This solution extends software with templates, samples and vector shapes for drawing Value Stream Maps (VSM).
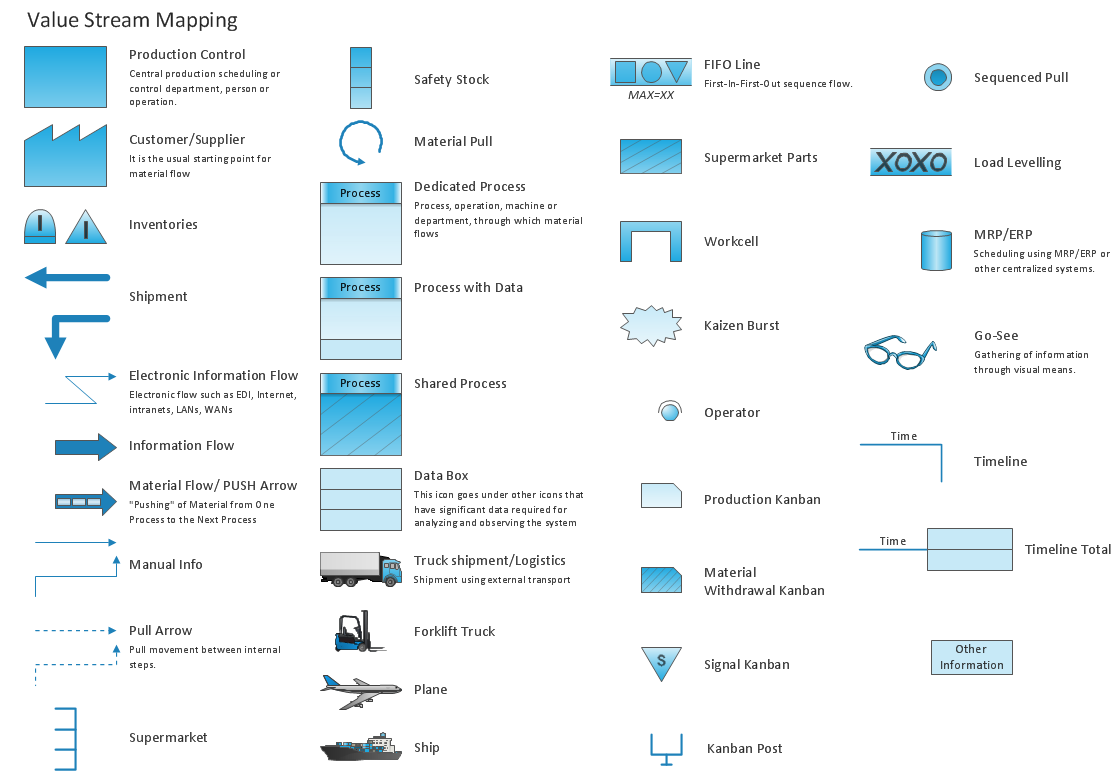
Pic.1 VSM design elements.
ConceptDraw solution Value Stream Mapping contains vector stencils library with standard shapes for VSM.
See also Samples:
TEN RELATED HOW TO's:
Software-Defined Networking (SDN) is a new powerful concept for decision these problems. SDN proposes to disaggregate the traditional networking stacks that are vertically integrated to customize the network operations for specialized environments and improve network service velocity.
On this example you can see the Software-Defined Networking (SDN) diagram that was created in ConceptDraw DIAGRAM using the Computer and Networks Area of ConceptDraw Solution Park.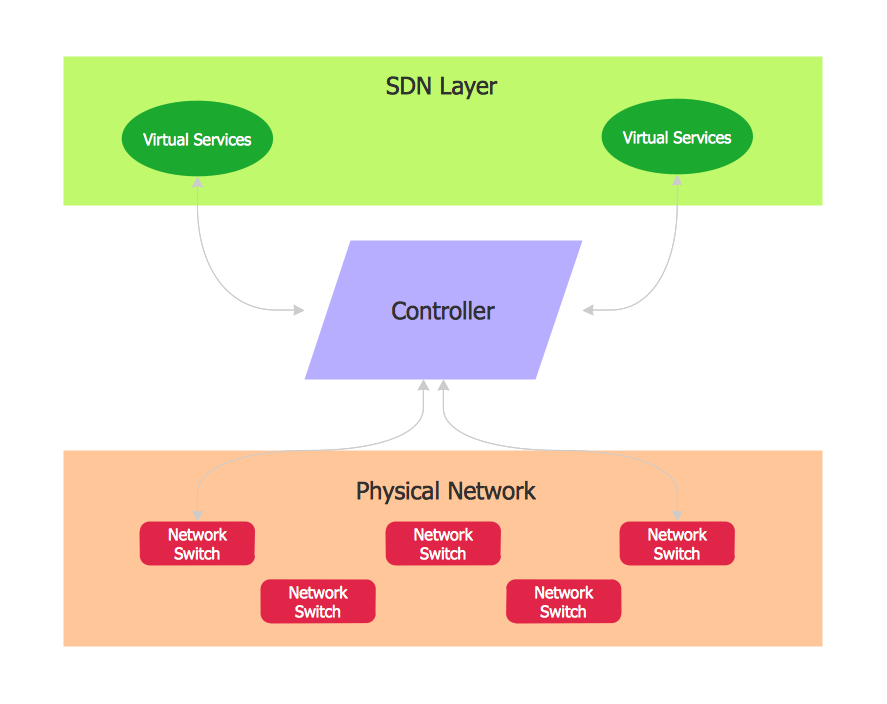
Picture: Software Defined Networking System Overview
Related Solution:
House of Quality Matrix Software - Use the predesigned objects from the Involvement Matrix Objects Library from the Seven Management and Planning Tools Solution to create professional looking House of Quality Matrices in minutes.
Picture: House of Quality Matrix Software
Related Solution:
This sample shows the Flowchart that displays the solid-state welding processes, the types of welding.
Picture: Types of Welding in Flowchart
Related Solution:
ConceptDraw DIAGRAM is a Mac OS X and Windows software. Numerous vector stencils, samples and templates created by designers are included in the basic package. This is classic flowchart maker which exactly follows the industry standards using flowchart symbols geathered during a ten years into solution park.
Picture: Flowchart Software
Related Solution:
UML Activity Diagram illustrate the business and operational step-by-step workflow of components in a system and shows the overall flow of control.
Picture: UML Activity Diagram. Design Elements
This sample was created in ConceptDraw DIAGRAM diagramming and vector drawing software using the UML Deployment Diagram library of the Rapid UML Solution from the Software Development area of ConceptDraw Solution Park.
This sample shows the work of the ATM (Automated Teller Machine) banking system that is used for service and performing of the banking transactions using ATMs. System engineers can use comprehensive UML diagrams solution.
Picture: UML Deployment Diagram Example - ATM SystemUML diagrams
Related Solution:
The Value Stream Mapping solution continues to extend the range of ConceptDraw DIAGRAM into a business graphics tool that can be used to document processes of Lean Manufacturing.
Picture: Lean Manufacturing Diagrams
Related Solution:
Connecting objects manually in ConceptDraw DIAGRAM is a snap:
- points;
- Connecting groups of objects;
- Auto-routing;
- Connectors text;
- Snap to Guides ;
- Quick.
Picture: ConceptDraw Arrows10 Technology
Draw your own business process flowcharts using ConceptDraw DIAGRAM diagramming and business graphics software.
The Flowcharts Solution for ConceptDraw DIAGRAM is a comprehensive set of examples and samples in several different color themes for professionals that need to graphically represent a process.
Picture: Flow Chart Diagram Examples
Related Solution:
Monitoring Deployment Management icons - Amazon AWS pro diagrams - AWS diagrams are part of architecturing tools provided with ConceptDraw Solution Park.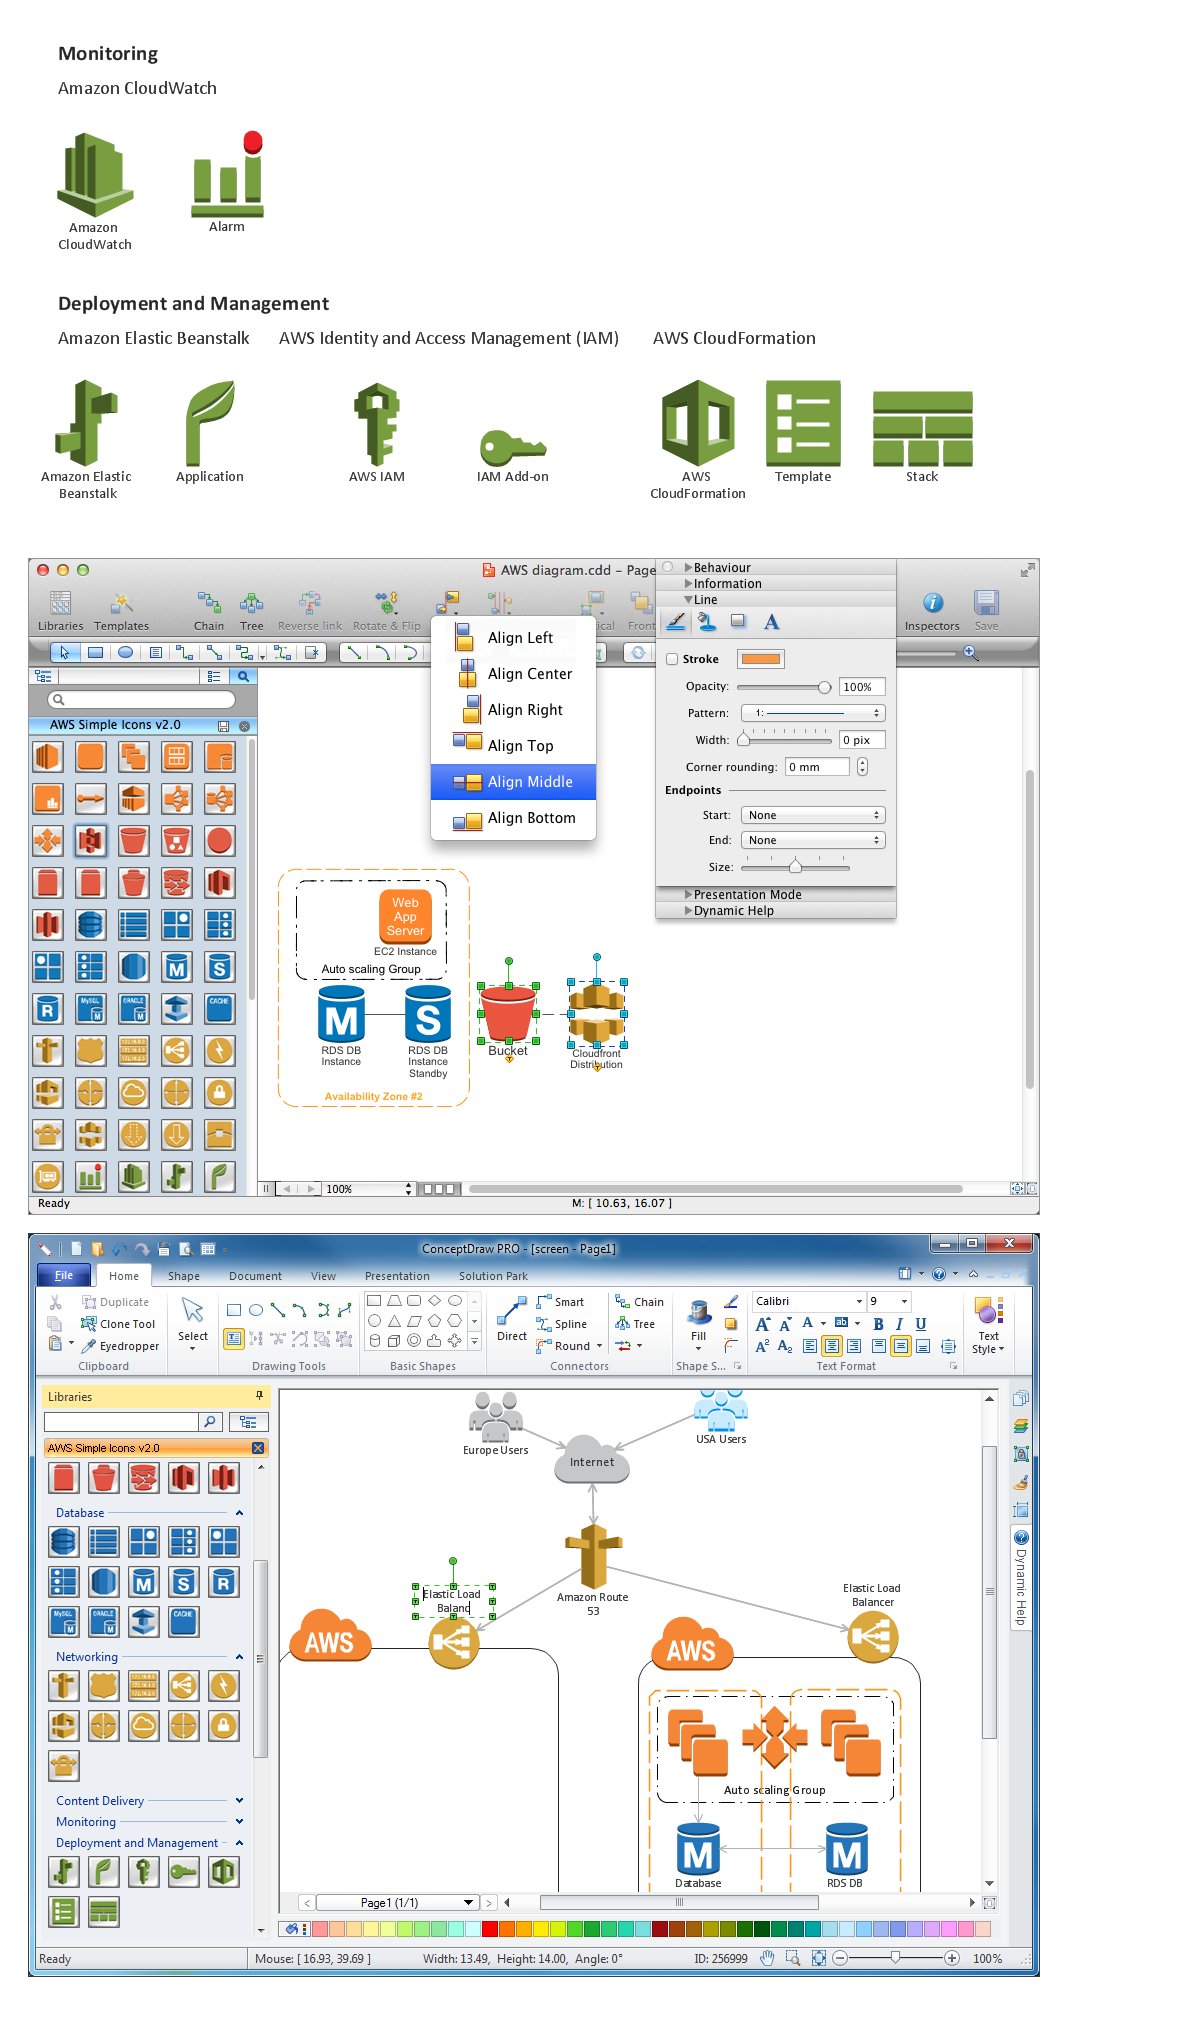
Picture: Diagramming software for Amazon Web Service icon set: Monitoring, Deployment, Management
ConceptDraw
MINDMAP 16