What is Value Stream Mapping?
Value Stream Mapping is a Lean Manufacturing tool that uses a flow diagram to document in great detail every step of a manufacturing process. The Value Stream Mapping solution from ConceptDraw Solution Park extends ConceptDraw DIAGRAM software with a new library that contain vector objects, samples and templates. With this well-designed vector objects users can draw Value Stream Mapping diagram. Also users can export resulting document to PDF, PowerPoint, and other popular graphic formats.

Pic.1 VSM diagram - Production control.
This sample Value Stream Map shows how customer value is created in the steps of manufacturing, production control, and shipping processes.
See also Samples:
TEN RELATED HOW TO's:
Learn the most common process flowchart symbols used in business process diagrams and workflow charts. Includes symbol meanings, examples, and a practical reference table.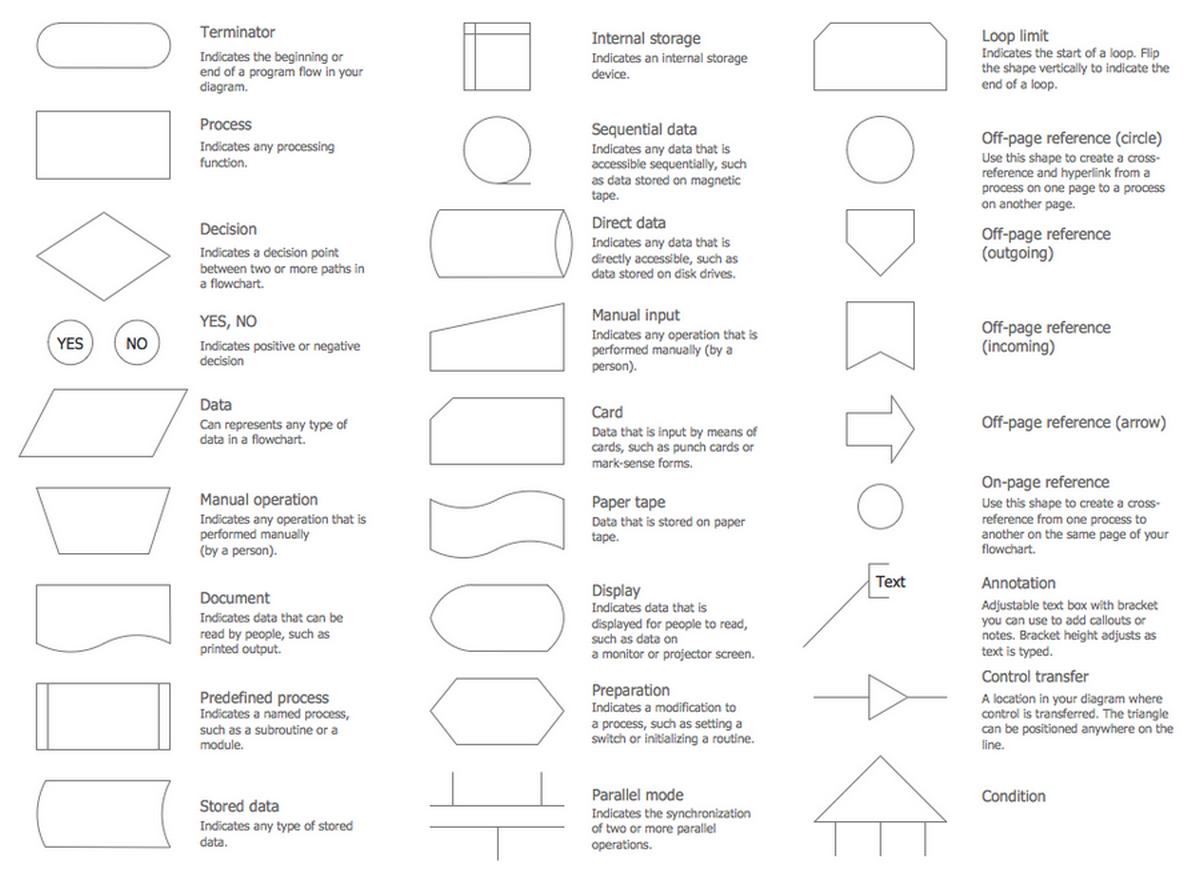
Picture: Process Flowchart Symbols: Meaning, Types and Examples
Related Solution:
The Total Quality Management Diagram solution helps your organization visualize business and industrial processes. Create Total Quality Management diagrams for business process with ConceptDraw software.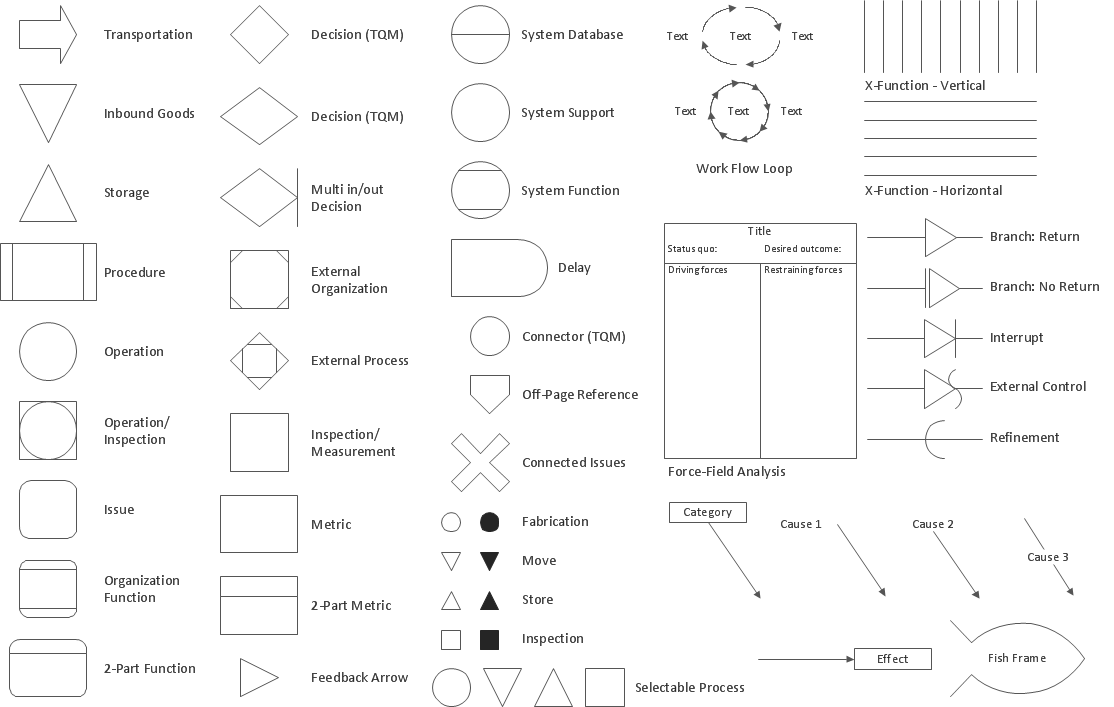
Picture: The Fifty Two Elements of TQM
Related Solution:
This sample shows the Business Process Reengineering Diagram, displays the Continuous Improvement Process (CIP) directed at the permanent improvement of the processes. This sample can be used in business process management, quality management, project management and program management.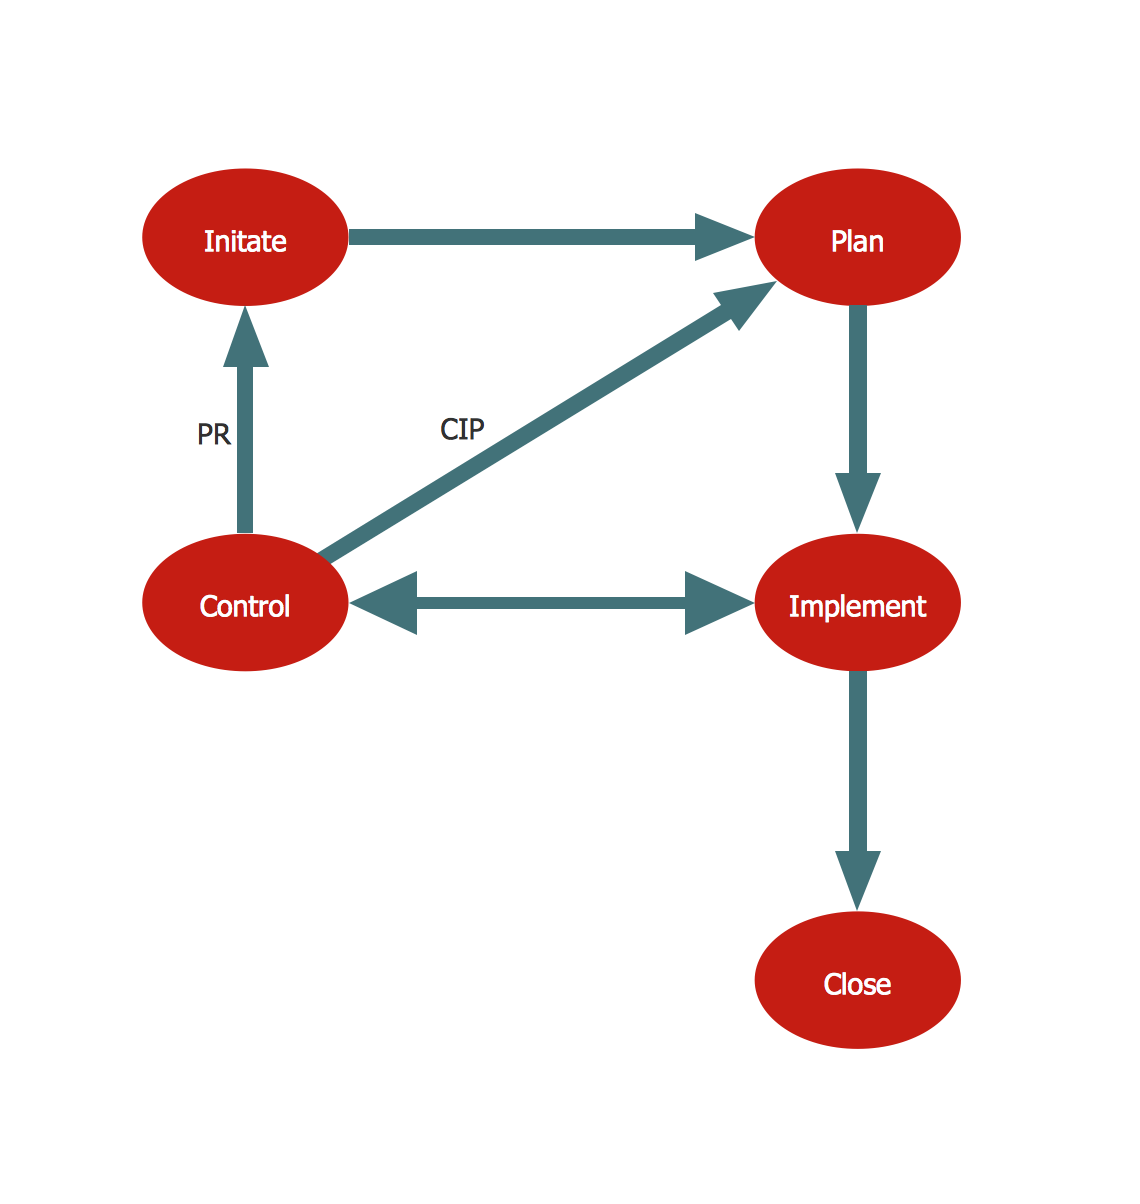
Picture: Business Process Reengineering. Business Process Example
Related Solution:
Event-Driven Process chain Diagrams for improvement throughout an organisation. Best software for Process Flow Diagram. The Event-driven Process Chain (EPC) Diagrams allows managers to plan processes and resources.
Picture: Business process Flow Chart — Event-Driven Process chain (EPC) diagrams
Related Solution:
The Line Graphs solution from Graphs and Charts area of ConceptDraw Solution Park contains a set of examples, templates and design elements library of scatter charts.
Use it to draw scatter graphs using ConceptDraw DIAGRAM diagramming and vector drawing software for illustrating your documents, presentations and websites.
Picture: Scatter Chart Examples
Related Solution:
The Flowcharts are widely used in engineering, architecture, science, analytics, government, politics, business, marketing, manufacturing, administration, etc.
Picture:
Flowchart of Products
Flowchart ExamplesRelated Solution:
Interactive tool helps you find the appropriate response to social media mentions quickly.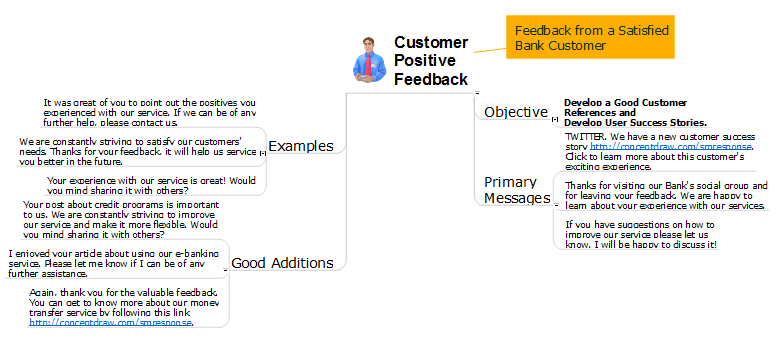
Picture: How to Prepare Learning Presentations for Training
Related Solutions:
ConceptDraw - Perfect Network Diagramming Software with examples of Backbone Network Diagrams. ConceptDraw Network Diagram is ideal for network engineers and network designers who need to draw Backbone Network diagrams.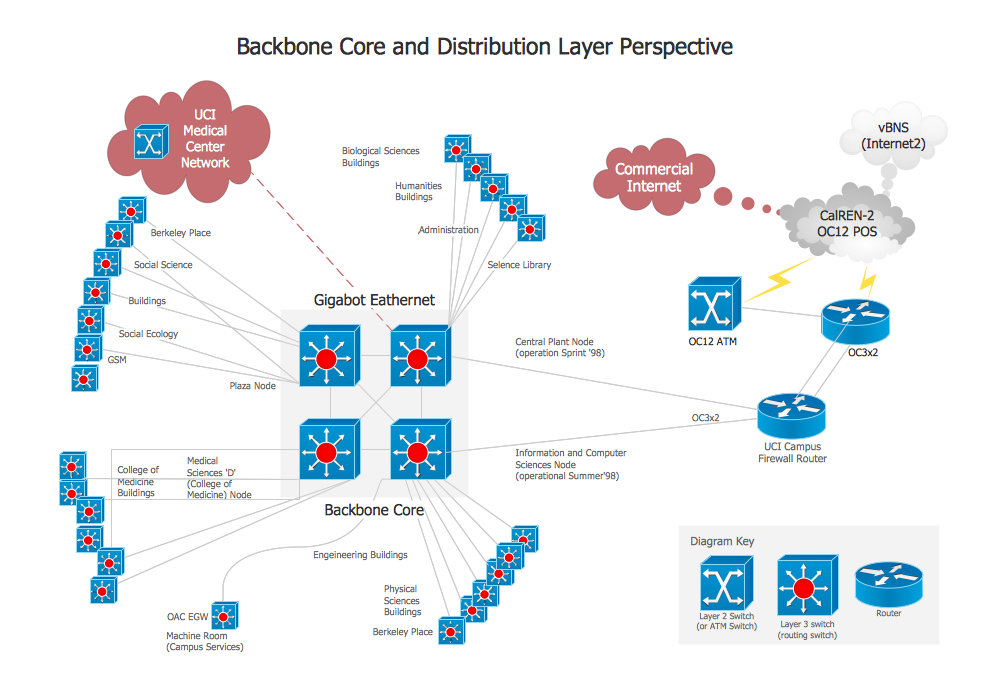
Picture: Network Diagram SoftwareBackbone Network
ConceptDraw MINDMAP has a addition to the ConceptDraw Solution Park that provides a creative approach to visualizing quality processes, Quality Mind Map Solution.
Picture: Mind Mapping in the Quality Management
Related Solution:
This sample was created in ConceptDraw DIAGRAM software using the Flowcharts solution.
Picture:
Copying Service Process Flowchart.
Flowchart Examples
Related Solution:
ConceptDraw
MINDMAP 16