Sales Teams are Inherently Competitive
Competitiveness pertains to the ability and performance of a firm, sub-sector or country to sell and supply goods and services in a given market, in relation to the ability and performance of other firms, sub-sectors or countries in the same market. [Wikipedia]
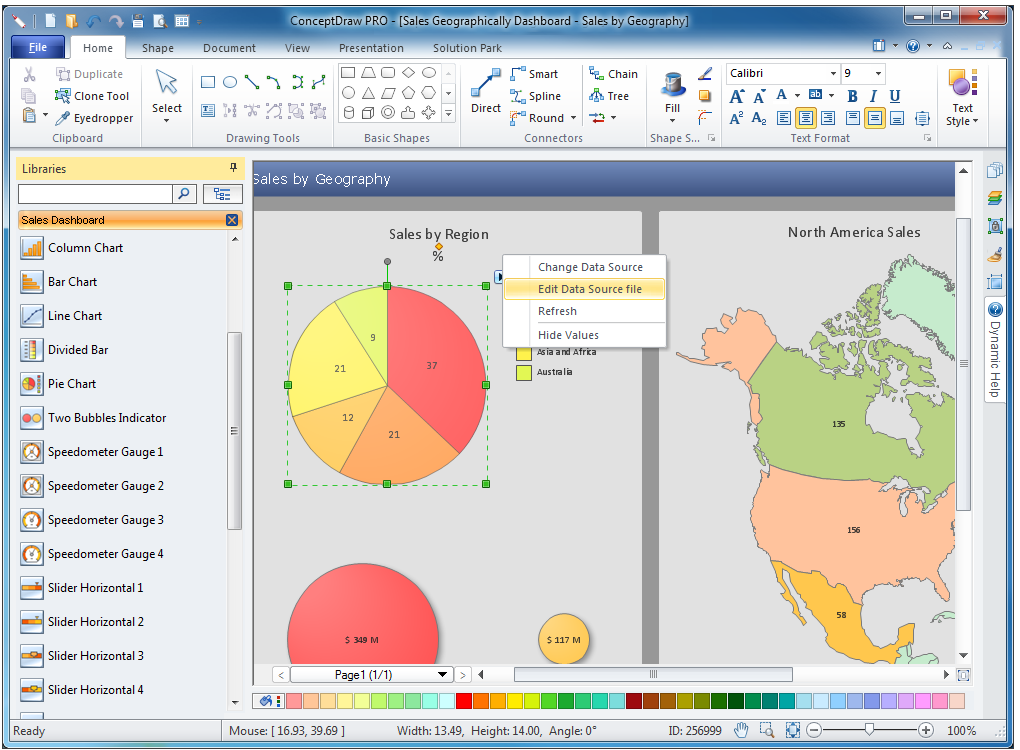
Sales Dashboard Solution
The Sales Dashboard Solution gives users the ability to use live data to drive displays that show sales performance in a wide variety of graphs.

Pic. 1. Sales Dashboard Solution
ConceptDraw DIAGRAM is a software for making Live charts anв gauges that provide effectiveness to your business.
By using dashboards one obtain benefits:
- Measure efficiencies/inefficiencies,
- Ability to generate detailed reports,
- Saves time compared to running multiple reports,
- Gain total visibility of all systems instantly.
Pic. 2. Sales Dashboard — Design Elements for Windows
Sales teams are inherently competitive, so you don't need to invent extra ways to stimulate the competition. At the same time, you can provide the team with a sales dashboard shows company, team and personal KPI to make the competition clear.
TEN RELATED HOW TO's:
Any business process consists from a number of tasks carrying out the certain business goal. It is useful to diagram business processes to ensure that they are as foolproof, logical and sequential as possible. This business process diagram describes a typical booking process flow by the example of a cab booking process. It can be used as a roadmap for any booking system implementation. Diagramming a business process allows you to look at the entire project and take into account all types of possible scenarios. Business process diagram helps you investigate and clarify the process thoroughly so that you can find out how it can be improved. Business process diagram supports team communications by ensuring that each process element is clear and everyone in the team is on the same page.
Sometimes your company brings you less profit than you expect it to be, and it’s difficult to reveal the causes. Maybe it’s time to learn new technologies, because business diagram are easily developed by means of special software, so you won’t make any extra effort. In return, you will increase your productivity and get more done in a less time.
Picture: Business Diagram Software
Related Solutions:
Boost your brand awareness and recognition through graphic design.
ConceptDraw DIAGRAM business graphics software provides wide opportunities for creativity and helps generate amazing visuals.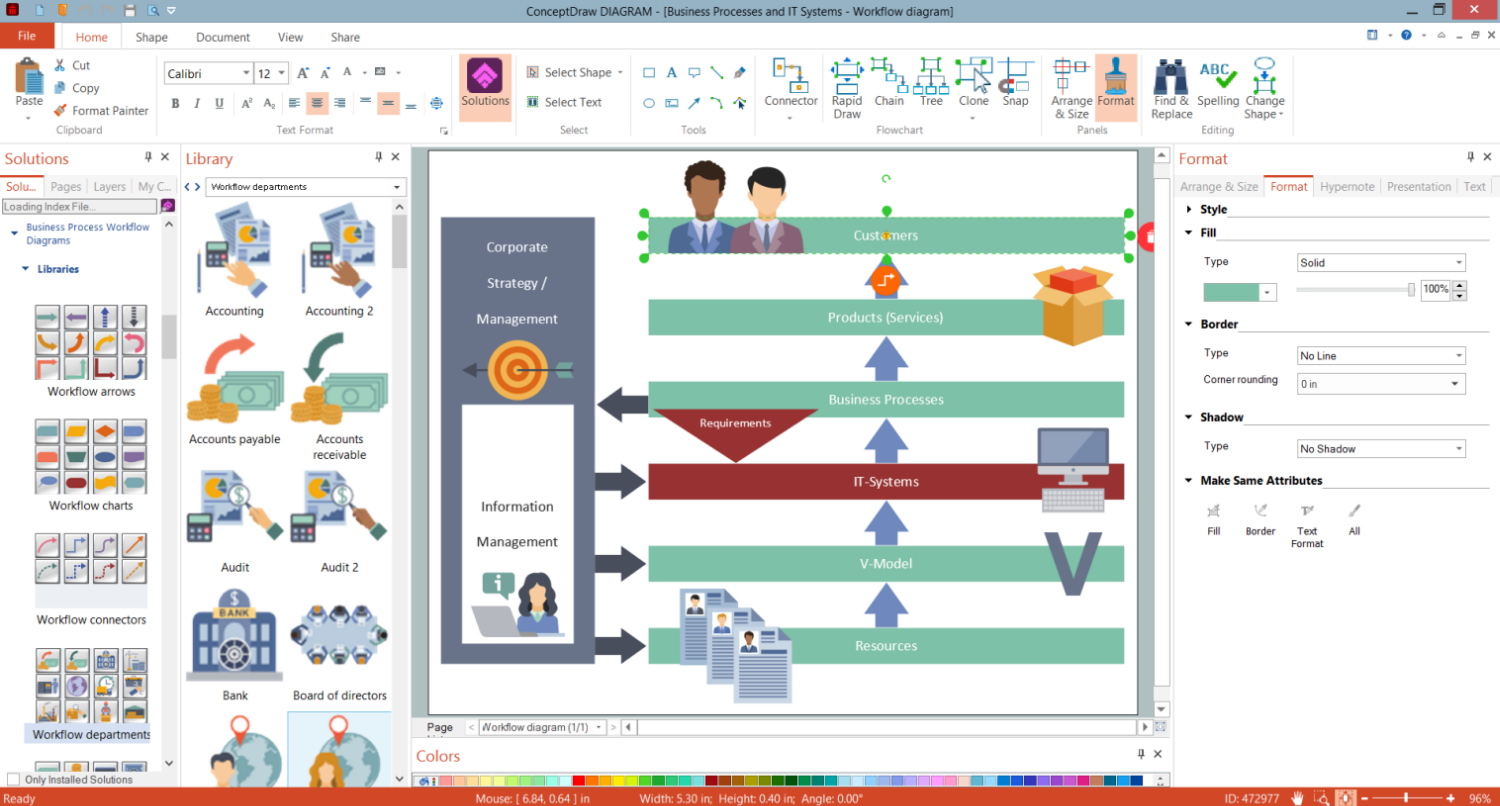
Picture: Business Graphics Software
Process mapping helps with sharing business results and reorganizing workflow. In almost every case, after creating a sales process flowchart the steps that are redundant become obvious for a manager. It's easy to find a flowchart examples that will help in developing one for your business.
This sales process flowchart consists of a sequence of steps that represent a simple sale process. Each step is shown graphically by a rectangle representing processing steps or an activity, or a diamond representing a decision. These rectangles are linked by arrows, that indicate the direction of the sales workflow. ConceptDraw Sales Flowcharts solution delivers a the full set of classical flowchart notation symbols, along with sales-related icons and pictograms.
Picture:
Sales Process Flowchart
Flowchart Examples
Related Solutions:
The Sales Process is a complex approach for selling a product or service which assumes many steps including the sales planning, realization of the sales marketing and management strategies, sales process analysis, etc. Now we have a ConceptDraw DIAGRAM software extended with unique Sales Flowcharts solution from the Marketing area of ConceptDraw Solution Park which ideally suits for the planning and realization the company's sales process.
Picture: The Sales Process
Related Solution:
You need create a Sales Process Map? Use the ConceptDraw DIAGRAM software which is ideal for the sales process management, marketing and engineering thanks to the powerful Sales Flowcharts solution from the Marketing area of ConceptDraw Solution Park.
Picture: Sales Process Map
Related Solution:
An example of marketing analysis diagram, can be used to analyse product market and define marketing strategy.
Picture: Marketing Analysis Diagram
Related Solution:
Create with our data flow diagram software perfect data flow diagrams. Download data flow diagram software for FREE. Use hundreds of data flow diagram examples.
Picture: Collaboration in a Project Team
To see how your business can improve you can try data visualization software solutions that allows you visualize all your sales KPI in one sales dashboard allows you monitor and analyse sales activities.
Picture: Data Visualization Software Solutions
When trying to figure out the nature of the problems occurring within a project, there are many ways to develop such understanding. One of the most common ways to document processes for further improvement is to draw a process flowchart, which depicts the activities of the process arranged in sequential order — this is business process management. ConceptDraw DIAGRAM is business process mapping software with impressive range of productivity features for business process management and classic project management. This business process management software is helpful for many purposes from different payment processes, or manufacturing processes to chemical processes. Business process mapping flowcharts helps clarify the actual workflow of different people engaged in the same process. This samples were made with ConceptDraw DIAGRAM — business process mapping software for flowcharting and used as classic visio alternative because its briefly named "visio for mac" and for windows, this sort of software named the business process management tools.
This flowchart diagram shows a process flow of project management. The diagram that is presented here depicts the project life cycle that is basic for the most of project management methods. Breaking a project into phases allows to track it in the proper manner. Through separation on phases, the total workflow of a project is divided into some foreseeable components, thus making it easier to follow the project status. A project life cycle commonly includes: initiation, definition, design, development and implementation phases. Distinguished method to show parallel and interdependent processes, as well as project life cycle relationships. A flowchart diagram is often used as visual guide to project. For instance, it used by marketing project management software for visualizing stages of marketing activities or as project management workflow tools. Created with ConceptDraw DIAGRAM — business process mapping software which is flowcharting visio alternative or shortly its visio for mac, this sort of software platform often named the business process management tools.
Picture: Process Flowchart: A Step-by-Step Comprehensive Guide
Related Solution:
A combination of sales KPI on a one dashboard helps you track sales activities and results. Visualizing sales data using ConceptDraw DIAGRAM software extended with the Sales Dashboard solutiongives you flexibility in choosing and tuning KPIs.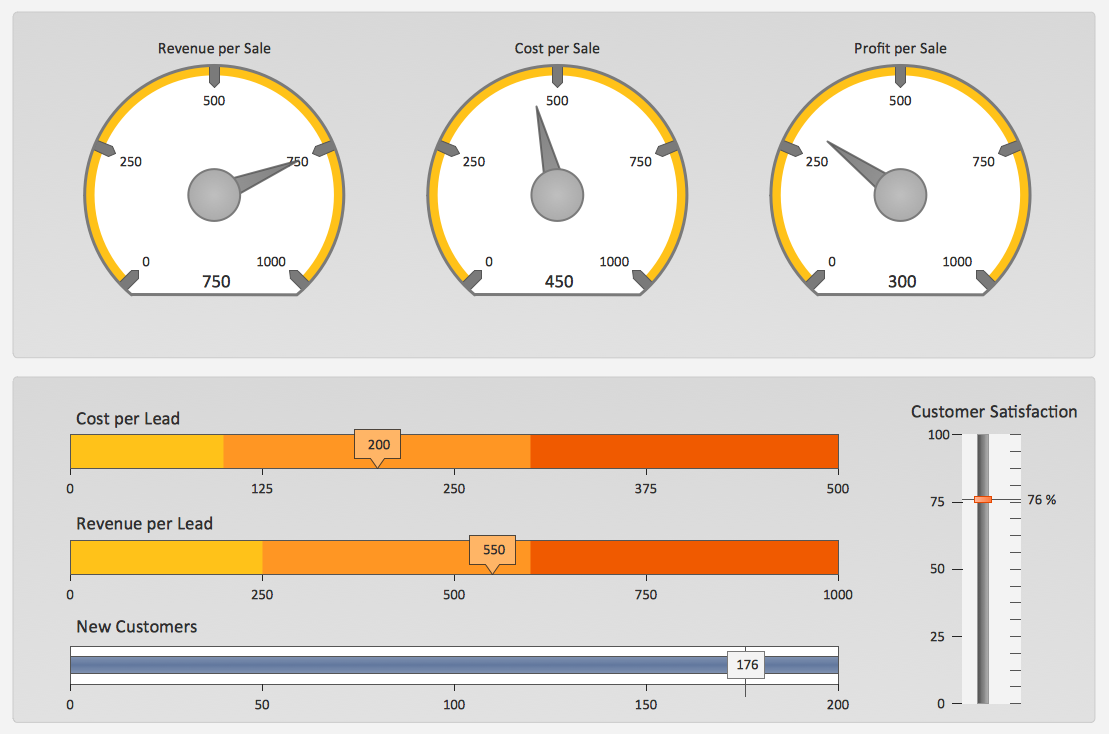
Picture: Sales KPI Dashboards
