Sales KPI Dashboards
Sales Dashboard Solution
The Sales Dashboard Solution gives users the ability to use live data to drive KPI dashboards that show sales performance in a wide variety of graphs. KPI Dashboards allow users to capture and report specific data points from sales department within the organization, thus providing a "snapshot" of performance.
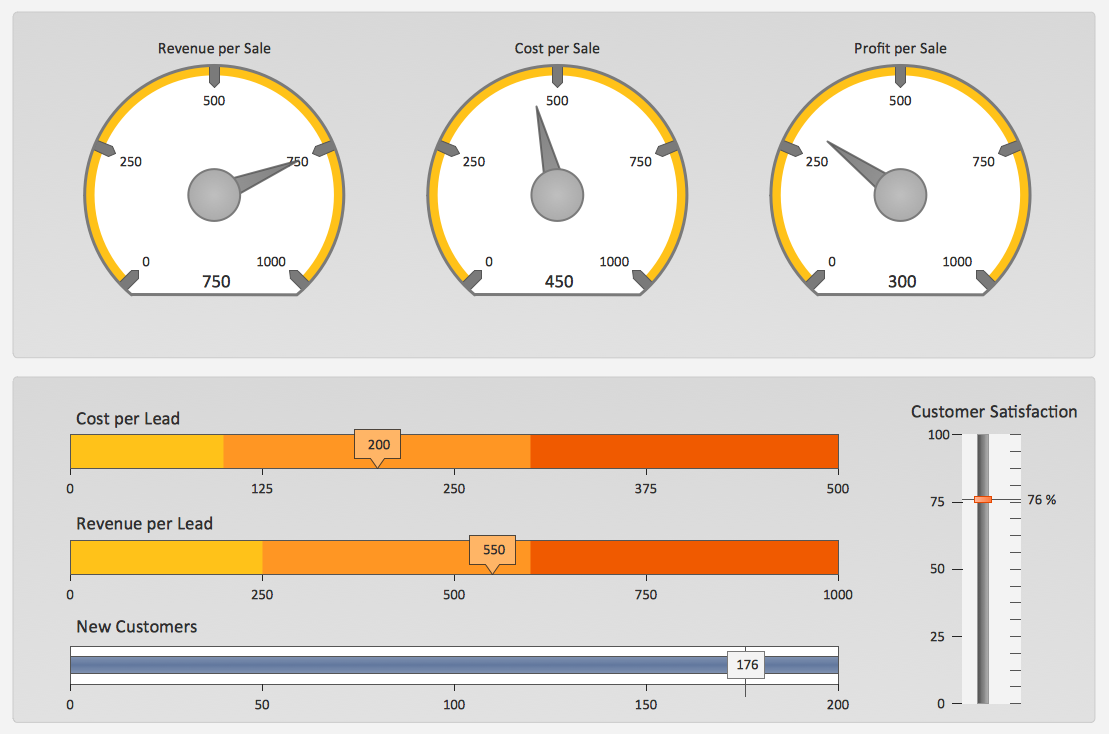
Pic. 1. Sales KPIs Dashboard Sample
FOUR RELATED HOW TO's:
Venn diagrams are illustrations used in the branch of mathematics known as set theory.
Use ConceptDraw DIAGRAM to quick and easy design your own Venn Diagram of any complexity.
Picture: Venn Diagram
Related Solution:
An effective way to improve your business is using reporting dashboard software. ConceptDraw DIAGRAM software extended with the Sales Dashboard solution helps you monitor all KPI on the one screen in real time.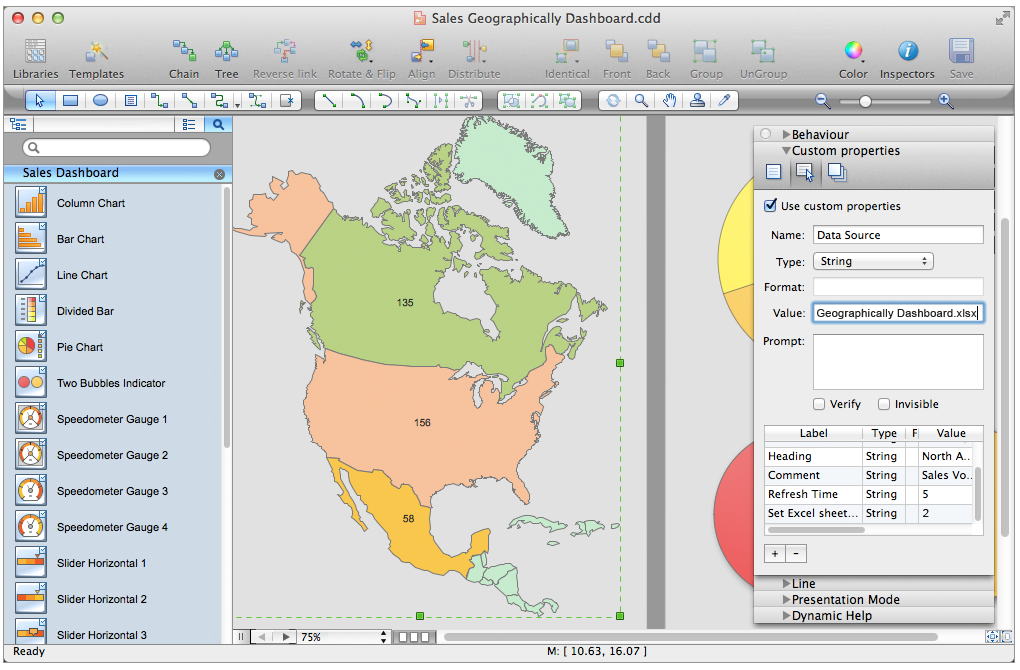
Picture: Reporting Dashboard Software for Business
The Total Quality Management Diagram solution helps you and your organization visualize business and industrial processes. Create Total Quality Management diagrams for business process with ConceptDraw software.
Picture: TQM Diagram Tool
Related Solution:
A Venn diagram, sometimes referred to as a set diagram, is a diagramming style used to show all the possible logical relations between a finite amount of sets. Having ConceptDraw DIAGRAM software one allows anyone who cares for their drawings to look not only nice but also smart and professional.
Picture:
Venn Diagram Examples for Problem Solving
Computer Science. Chomsky HierarchyRelated Solution:
ConceptDraw
DIAGRAM 18