Sales Dashboard - insight about potential
opportunities and key sales operations
Sales Dashboard Solution
The Sales Dashboard Solution gives users the ability to use live data to drive dashboards that show sales performance in a wide variety of graphs. Dashboards allow you to capture and report specific data points from each department within the organization, thus providing a "snapshot" of performance.

Pic. 1. Sale Dashboard
FOUR RELATED HOW TO's:
Visualizing sales data you may need a good example to start. ConceptDraw Sales Dashboard solution delivers a complete set of templates and samples you can use as examples to start composing your own sales dashboard.
Picture: Sales Dashboard Examples
Sales Dashboard is a useful and visual way of representing sales performances, tracking and analyzing sales. It gives a clear picture about the business development success and sales growth progress.
ConceptDraw DIAGRAM software extended with Sales Dashboard solution from the Marketing area of ConceptDraw Solution Park is effective for visualizing sales data, all set of KPIs on the Sales Dashboard with purpose to see how your business develops and to make conclusions for improvement the sales.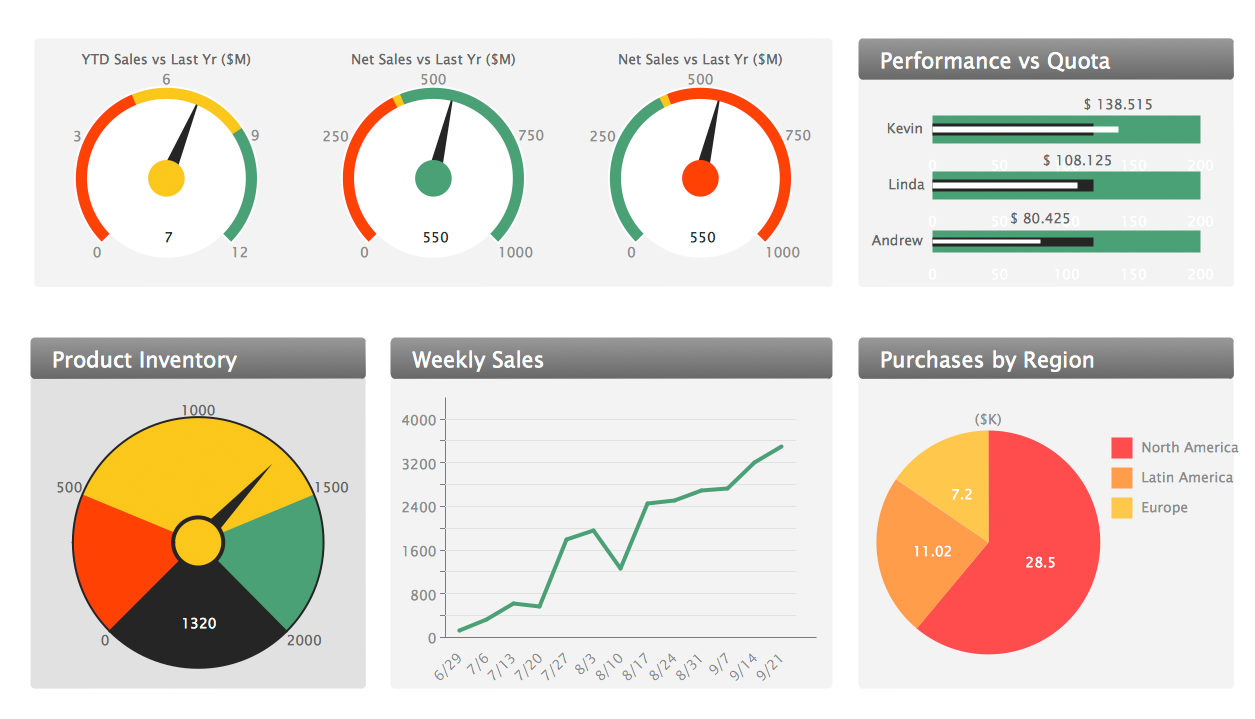
Picture: Sales Dashboard
Related Solution:
ConceptDraw Sales Dashboard is an automatically updated sales dashboard you can customize to see KPI you need. You can access sales dashboard anywhere to get fresh data and use any minute to see how your business can improve.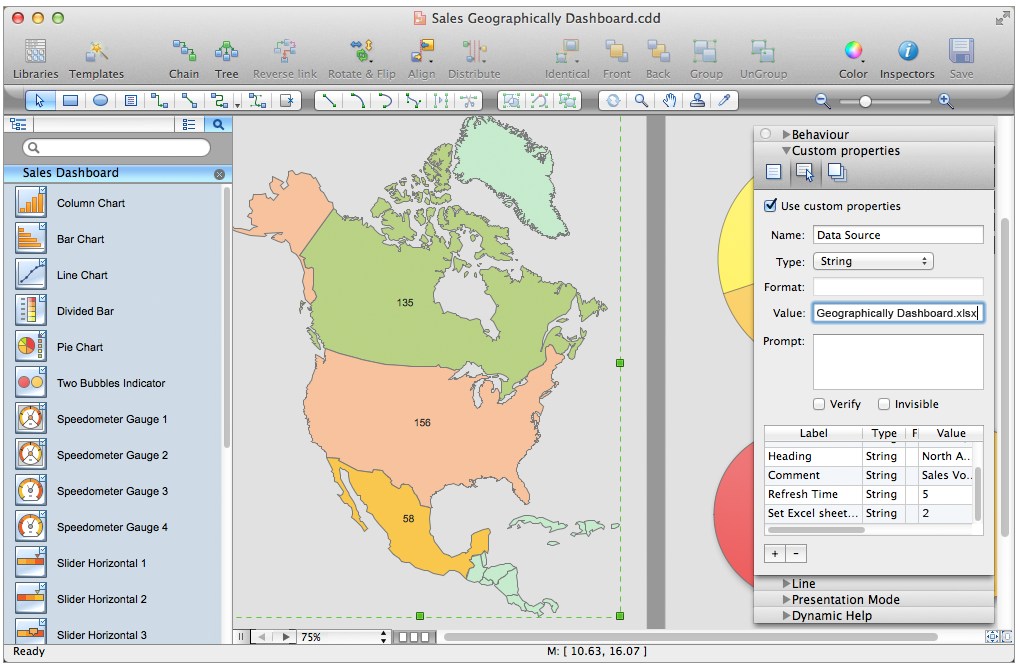
Picture: Sales Dashboard - Access Anywhere
Sales dashboard is a tool that provides the answers to all questions your sales team may have. A mature sales dashboard provides complete set of KPI to shows corporate, team or personal performance to keep sales process clear.
Picture: A KPI Dashboard Providesthe Answers Your Sales Team
ConceptDraw
DIAGRAM 18