Quality Engineering Diagrams
ConceptDraw DIAGRAM is a bundle of the vector stencils, examples, and templates for drawing quality diagrams. Value Stream Mapping solution is a Lean Manufacturing tool that uses a flow diagram to document in great detail every step of a manufacturing process. This graphical representation of a process is a powerful tool that helps in the diagnosis of process efficiency and allows company to develop improved processes.
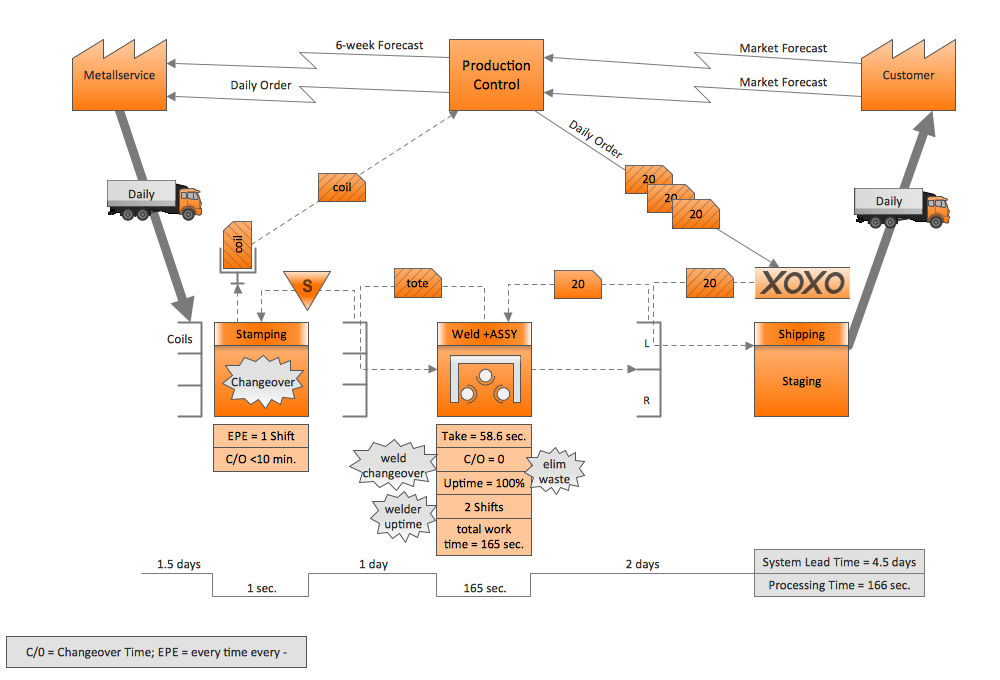
Pic.1 Value stream mapping (VSM) sample.
This example of a Value Stream Map diagram was drawn using ConceptDraw DIAGRAM with the Value Stream Mapping solution from ConceptDraw Solution Park.
This sample VSM flowchart shows the value stream in a manufacturing, production control and shipping processes.
See also Samples:
TEN RELATED HOW TO's:
As restaurant industry is growing rapidly nowadays, researches show that almost half of the adults have worked in a restaurant or a cafe. Moreover, many of them dream to start their own someday. Unfortunately, it takes a lot of time to write a business plan and to find a great location, although some know how to create a restaurant floor plan in minutes or how to plan budget effortlessly. Hiring employees can also cause a lot of headache, but this is crucial for further success, because every guest comes to restaurant for a good service and delicious food. It is also worth noting that restaurant concept is also important, because it defines target audience and influences the menu.
This diagram represents the floor plan of an ongoing sports-theme establishment - restaurant, cafe, or other food service. A number of widescreen monitors installed along the perimeter provide visitors the opportunity to follow the course of a match from anywhere in the dining room of restaurant or cafe. The most of sports fans believe that food and alcohol is a big part of any sports show. That is why the dining room takes the most space - almost 60% of the total establishment space. Nearly all sports fans consume beverages while watching sports - beer, soda or water at least. Thus, the restaurant floor plan designers added a large lavatory there. Moreover, project developers considered unnecessary the gender division of such delicate place - perhaps they guess that only men are watching football, or believe that alcohol will eliminate the most of gender differences.
Picture: How To Create Restaurant Floor Plan in Minutes
Related Solution:
The Cisco Network Diagrams Solution from the Computer and Networks area of ConceptDraw Solution Park helps you to create the Cisco Network Diagrams quick and easy using the ConceptDraw DIAGRAM diagramming and vector drawing software.
The Cisco Network Diagrams Solution contains 14 libraries with 450 ready-to-use predesigned vector objects.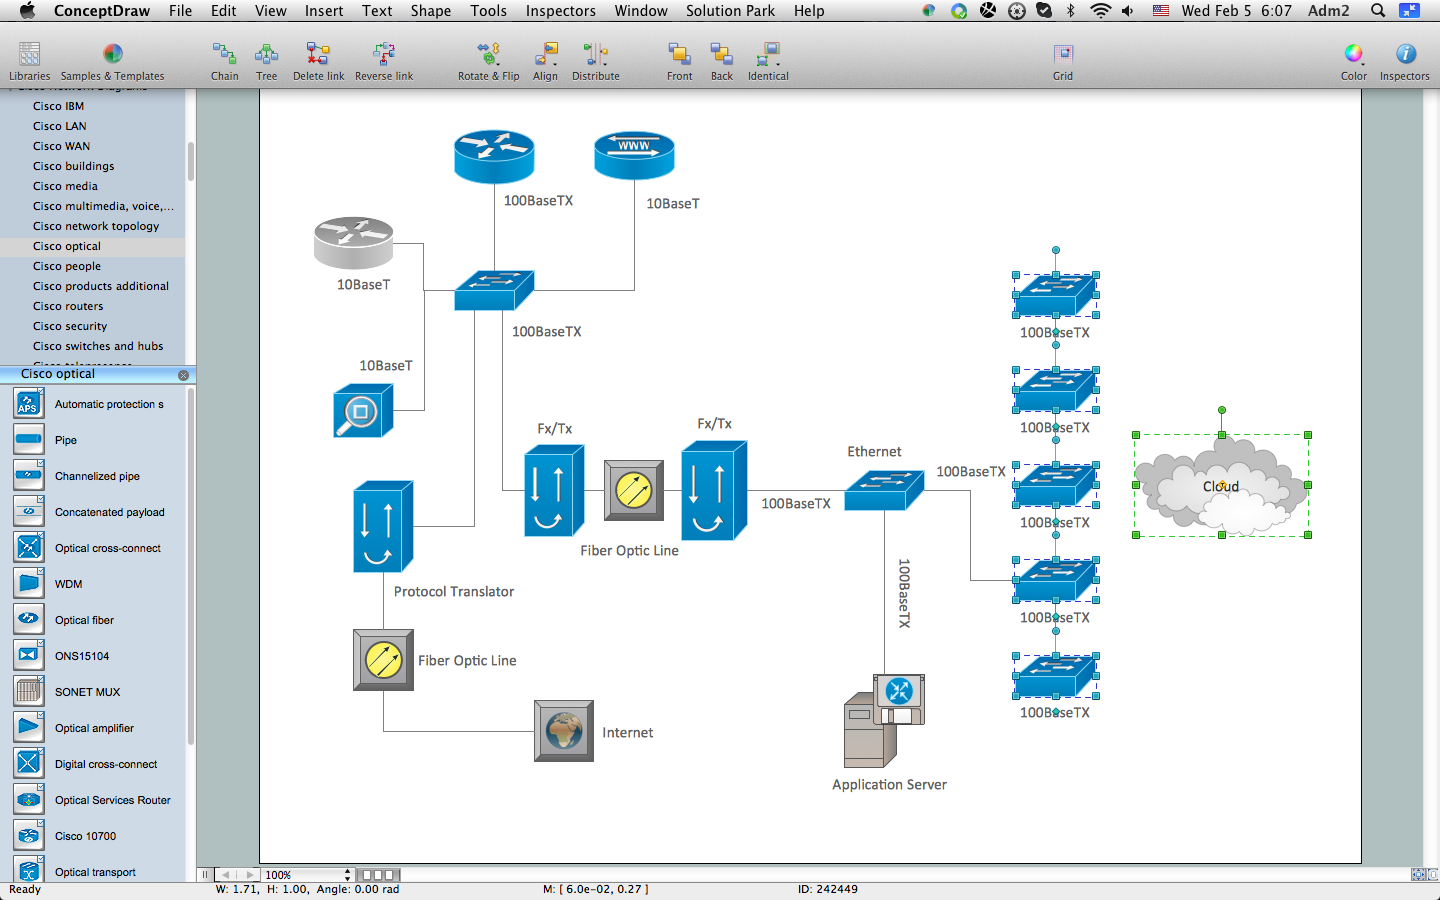
Picture: How to Create Cisco Network Diagram
Related Solution:
This sample shows the Data Flow Diagram of the Taxi Service and interactions between the Clients, Operators and Divers, as well as Orders and Reports databases.
Picture: Taxi Service Data Flow DiagramDFD Example
Related Solution:
Every engineering project starts from a terms of reference document. The next stage of developing is a technical drawing, which requires using appropriate software. However, revisions and discussions about requirements are possible at any stage of development.
This technical drawing demonstrates a schematic flow diagram of pulp reclaiming. This diagram of magnetite pulp reclaiming is created using ConceptDraw Chemical and Process engineering solution, The solution delivers more than 460 vector graphic icons and connectors. Generally, it is intended for designing process and instrumentation diagrams (P&ID) for chemical and process engineering. block flow diagrams (BFD), process flow diagrams (PFD) for chemical industry.
Picture: Technical Drawing Software
Related Solution:
ConceptDraw DIAGRAM is a powerful Network Engineering software thanks to the Vehicular Networking Solution and many other networking solutions from the Computer and Networks Area of ConceptDraw Solution Park.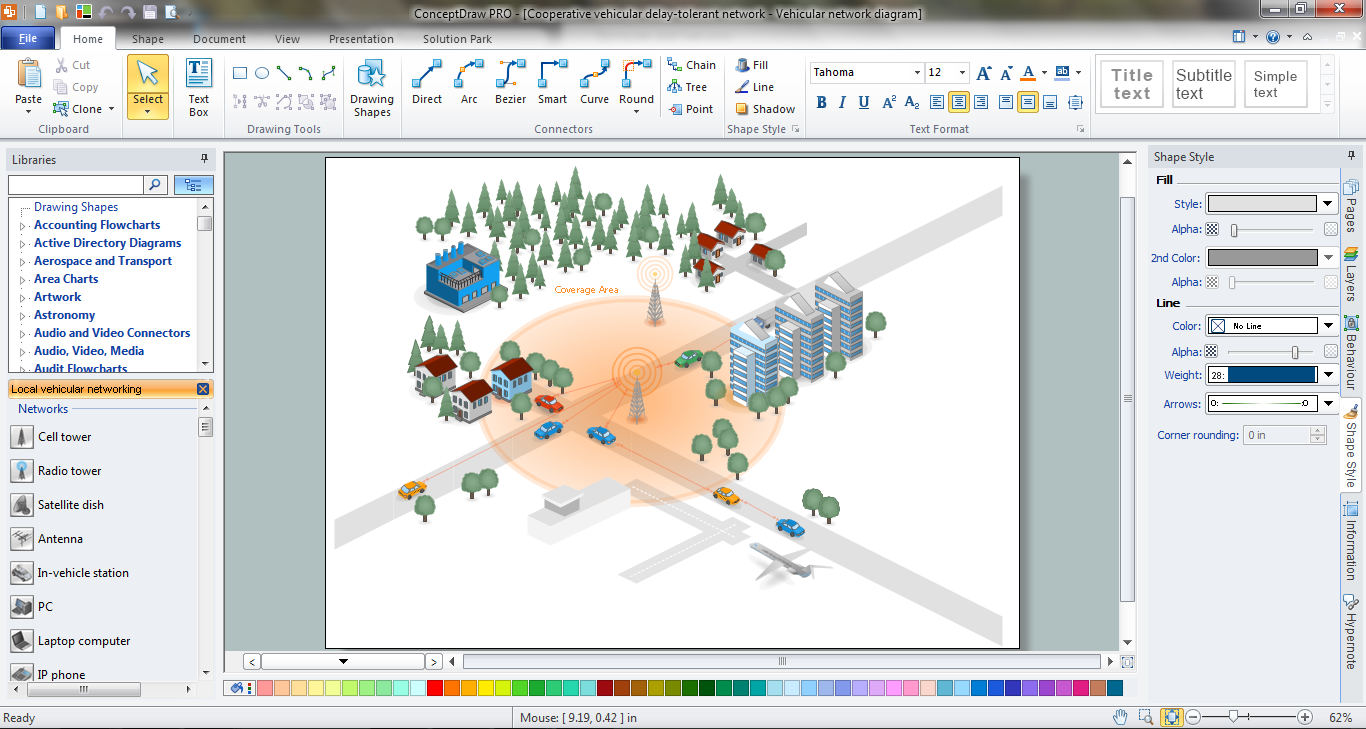
Picture: Network Engineering
Related Solution:
Electrical Engineering Solution used together with ConceptDraw DIAGRAM drawing facilities makes short a work of drawing various electrical and electronic circuit schemes. A library of vector objects composed from symbols of Analog and Digital Logic elements of electric circuit includes 40 symbolic images of logic gates, bistable switches of bi-stable electric current, circuit controllers, amplifiers, regulators, generators, etc. All of them can be applied in electronic circuit schemes for showing both analog and digital elements of the circuit.
Electrical Engineering Solution used together with ConceptDraw DIAGRAM drawing facilities makes short a work of drawing various electrical and electronic circuit schemes. A library of vector objects composed from symbols of Analog and Digital Logic elements of electric circuit includes 40 symbolic images of logic gates, bistable switches of bi-stable electric current, circuit controllers, amplifiers, regulators, generators, etc. All of them can be applied in electronic circuit schemes for showing both analog and digital elements of the circuit.
Picture:
Electrical Diagram Symbols F.A.Q.
How to Use Electrical ConceptDraw Diagram Software
Related Solution:
The Value stream is a totality of all actions on the projection, order composition and production: starting from creation a product project to launching this product, from order to delivery, from extraction of raw materials to ready product manufacturing. Value stream mapping is a process of visualization of these actions and creation of a detailed and graphical map.
Picture: Value stream with ConceptDraw DIAGRAM
Related Solution:
Many of us want to be able to create designs efficiently yet quickly. ConceptDraw DIAGRAM will help you to make awesome drawings without having to design all those Time Elements. These elements include graphs, symbols, cliparts, visual data representation and a whole lot of other stuff.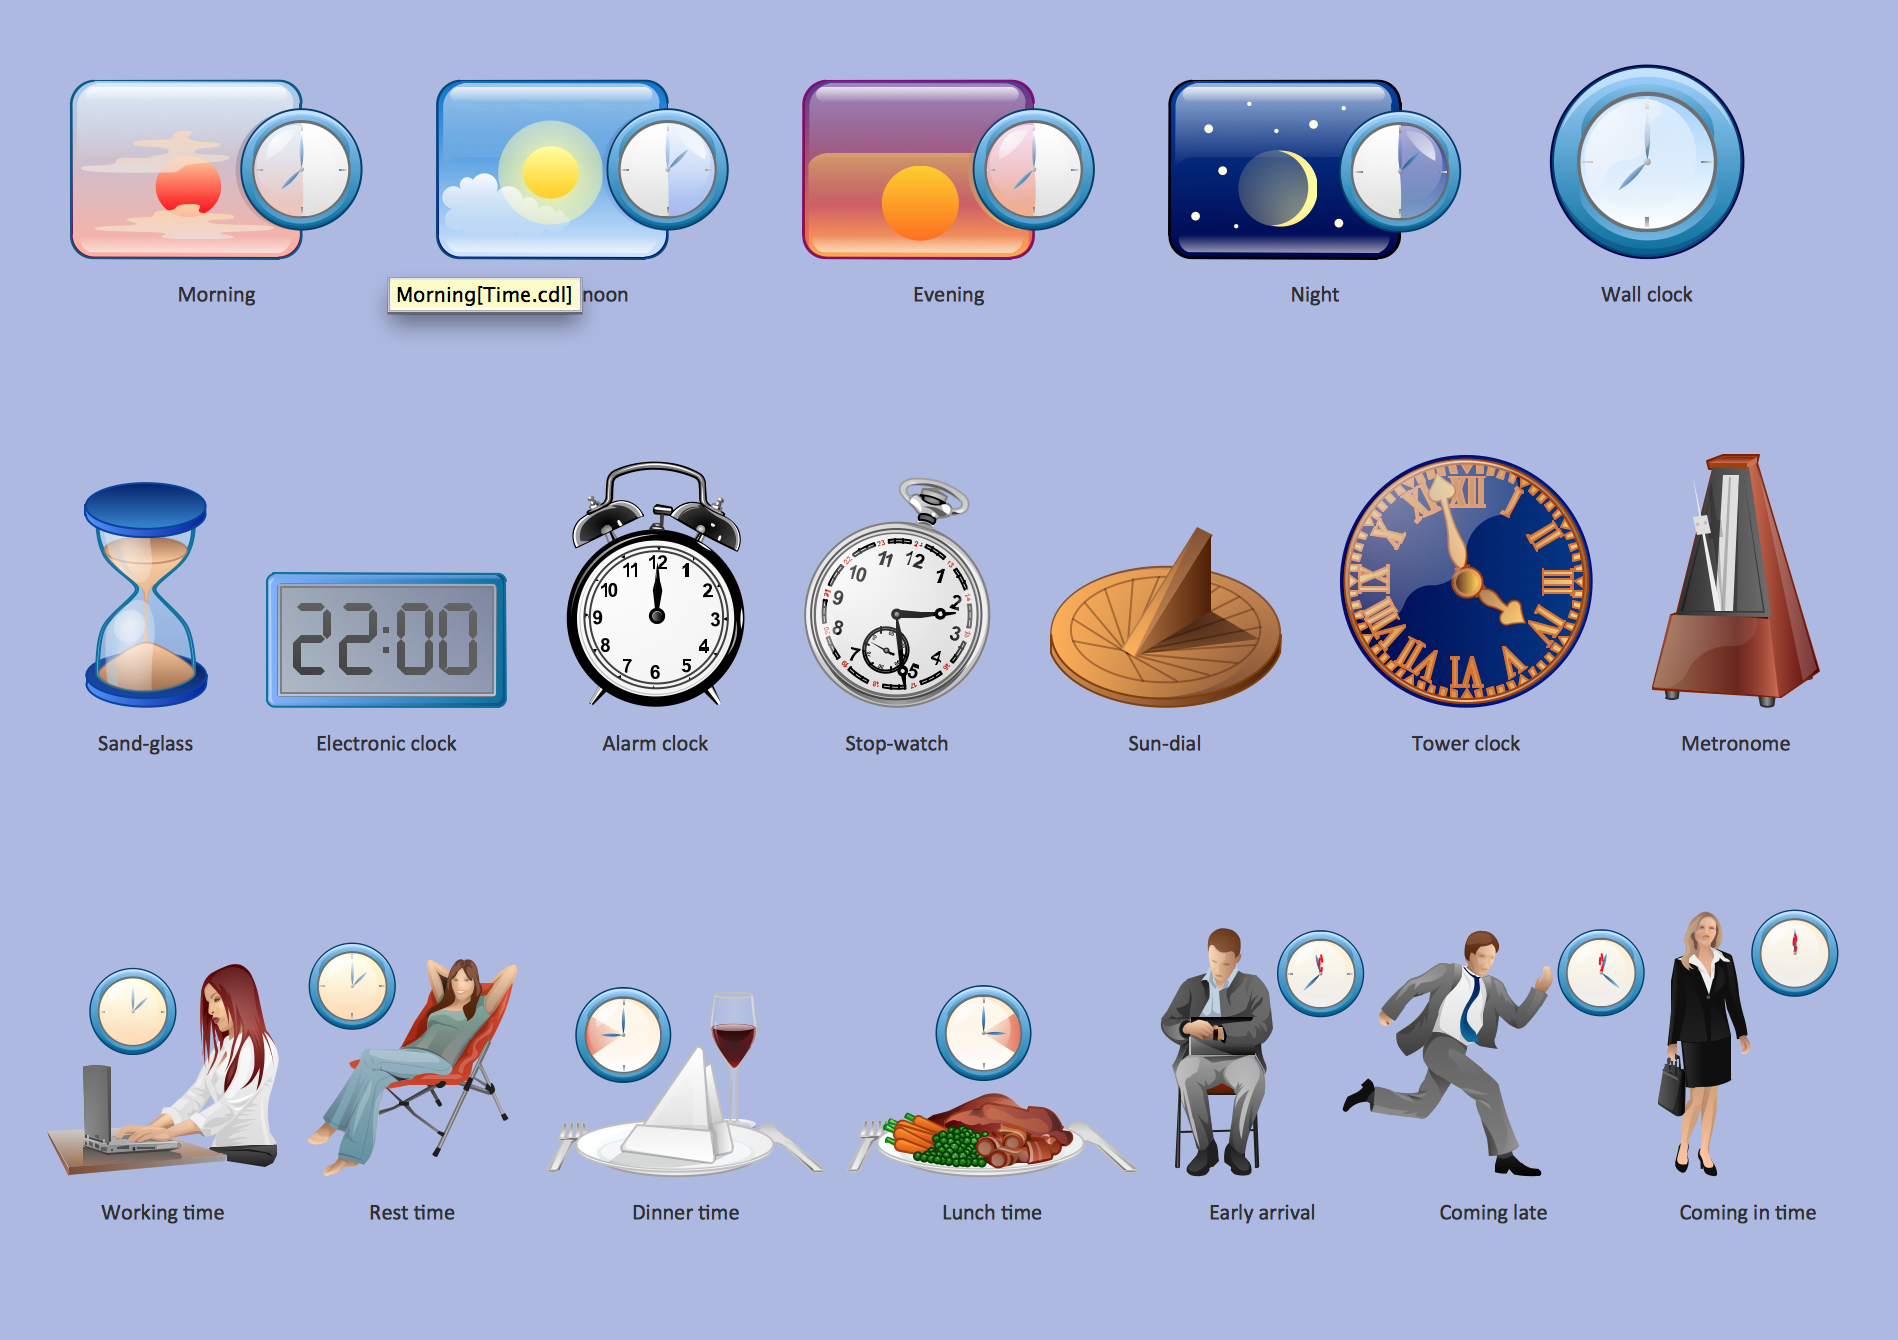
Picture: Time - Design Elements
Related Solution:
This sample shows the Business Process Reengineering Diagram. Reengineering is the process of the business processes optimizations. This sample can be used in business process management, quality management, project management and program management.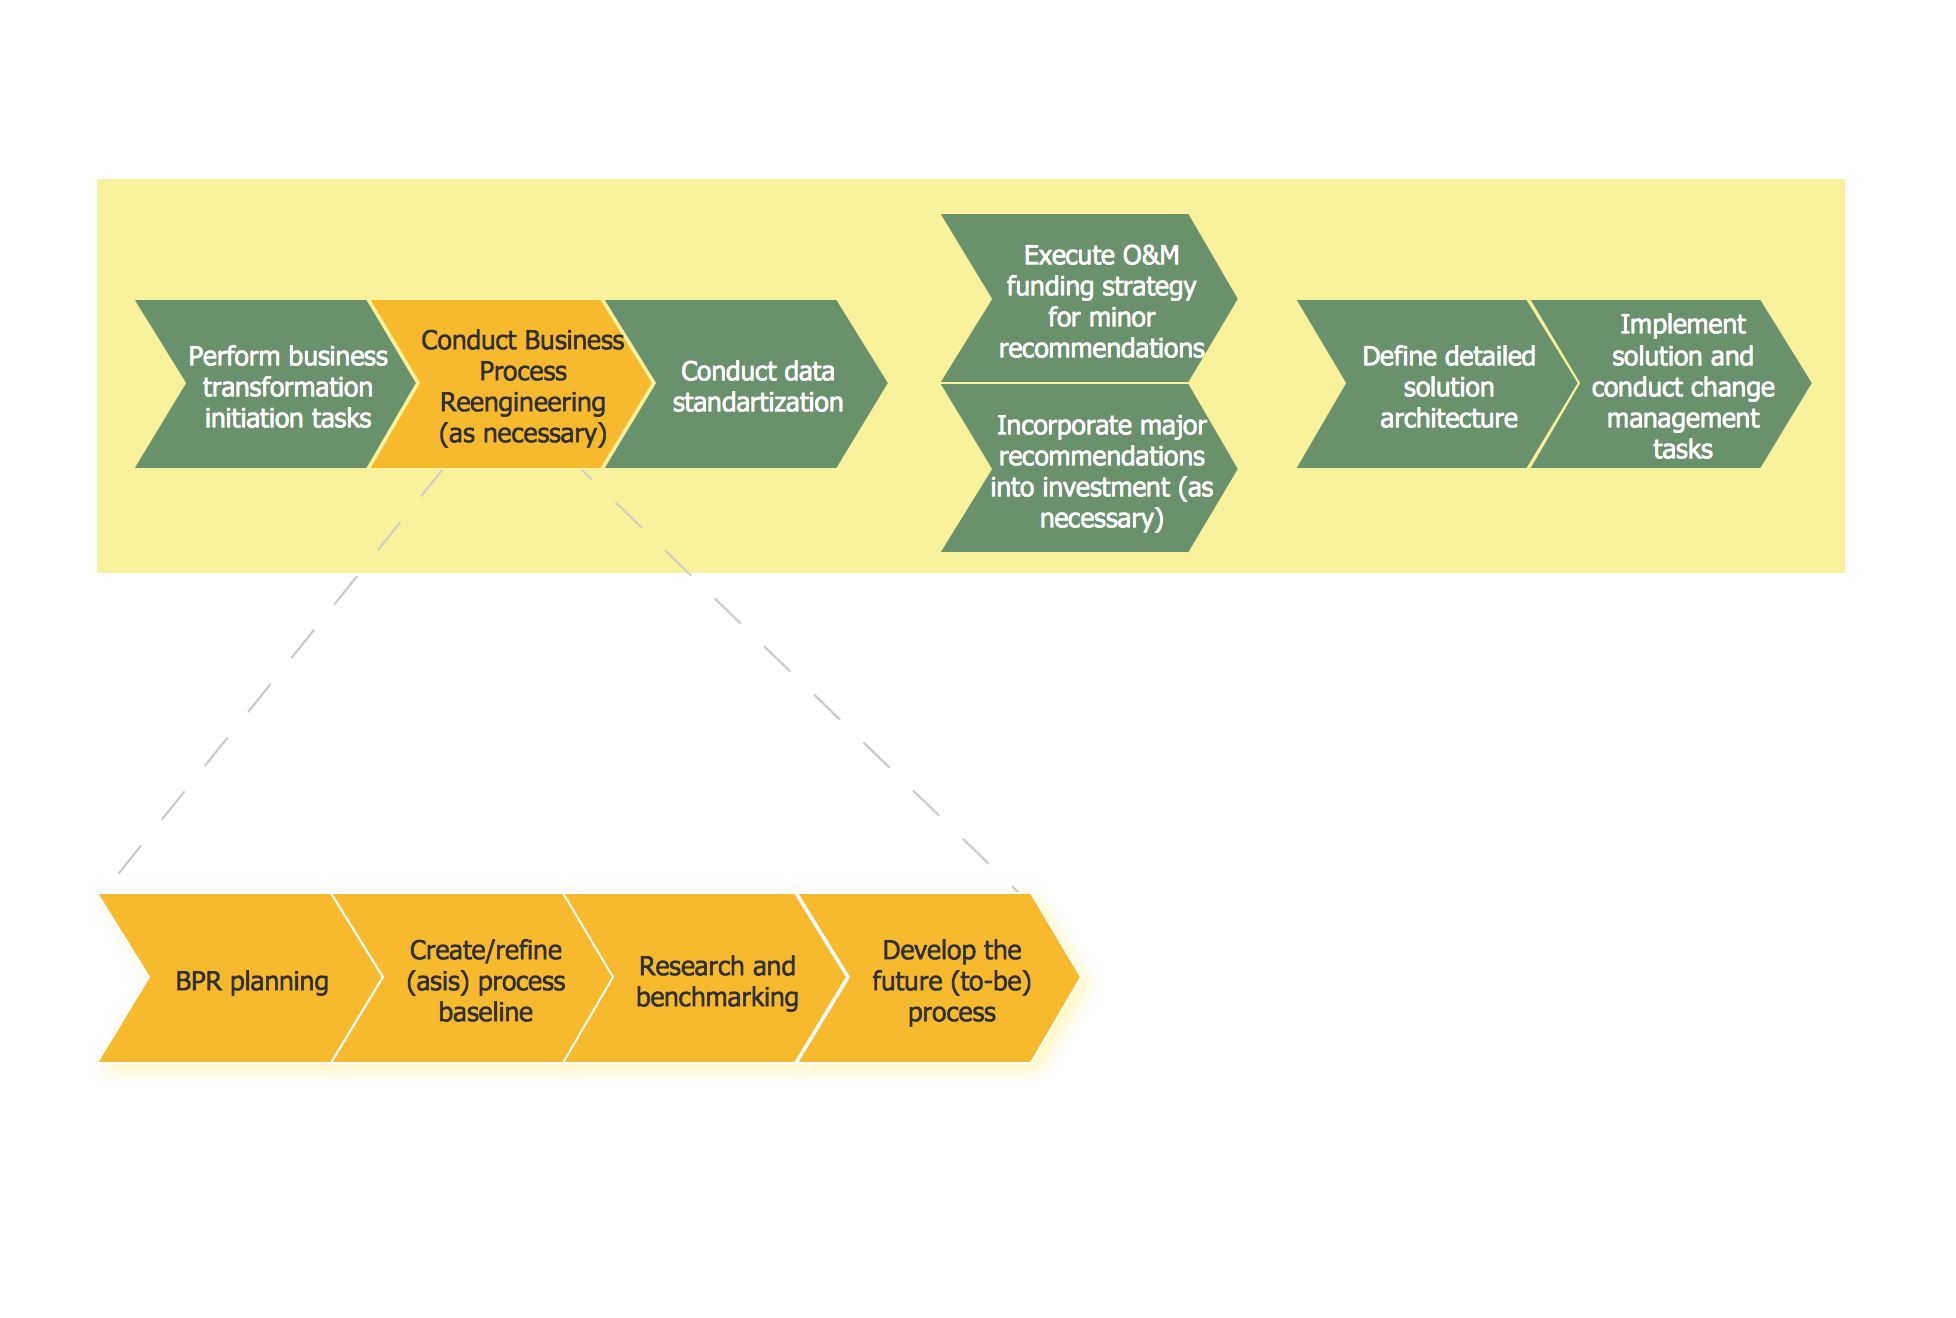
Picture: Business Process Reengineering Examples
Related Solution:
When you need to visually represent the structure of relational database, Entity relationship diagram (ERD) is a type of diagram for that case.
Most entity-relationship diagrams can be built with objects from Flowchart solution or ERD Solution which contains inbuilt templates. Follow these steps to create your own custom ERD diagram.
Don't be frightened if it looks complex, ConceptDraw DIAGRAM makes it easy to create an ERD, and hundreds of other diagrams, in minutes.
Picture: Developing Entity Relationship Diagrams
Related Solution:
ConceptDraw
MINDMAP 16