Business Architecture
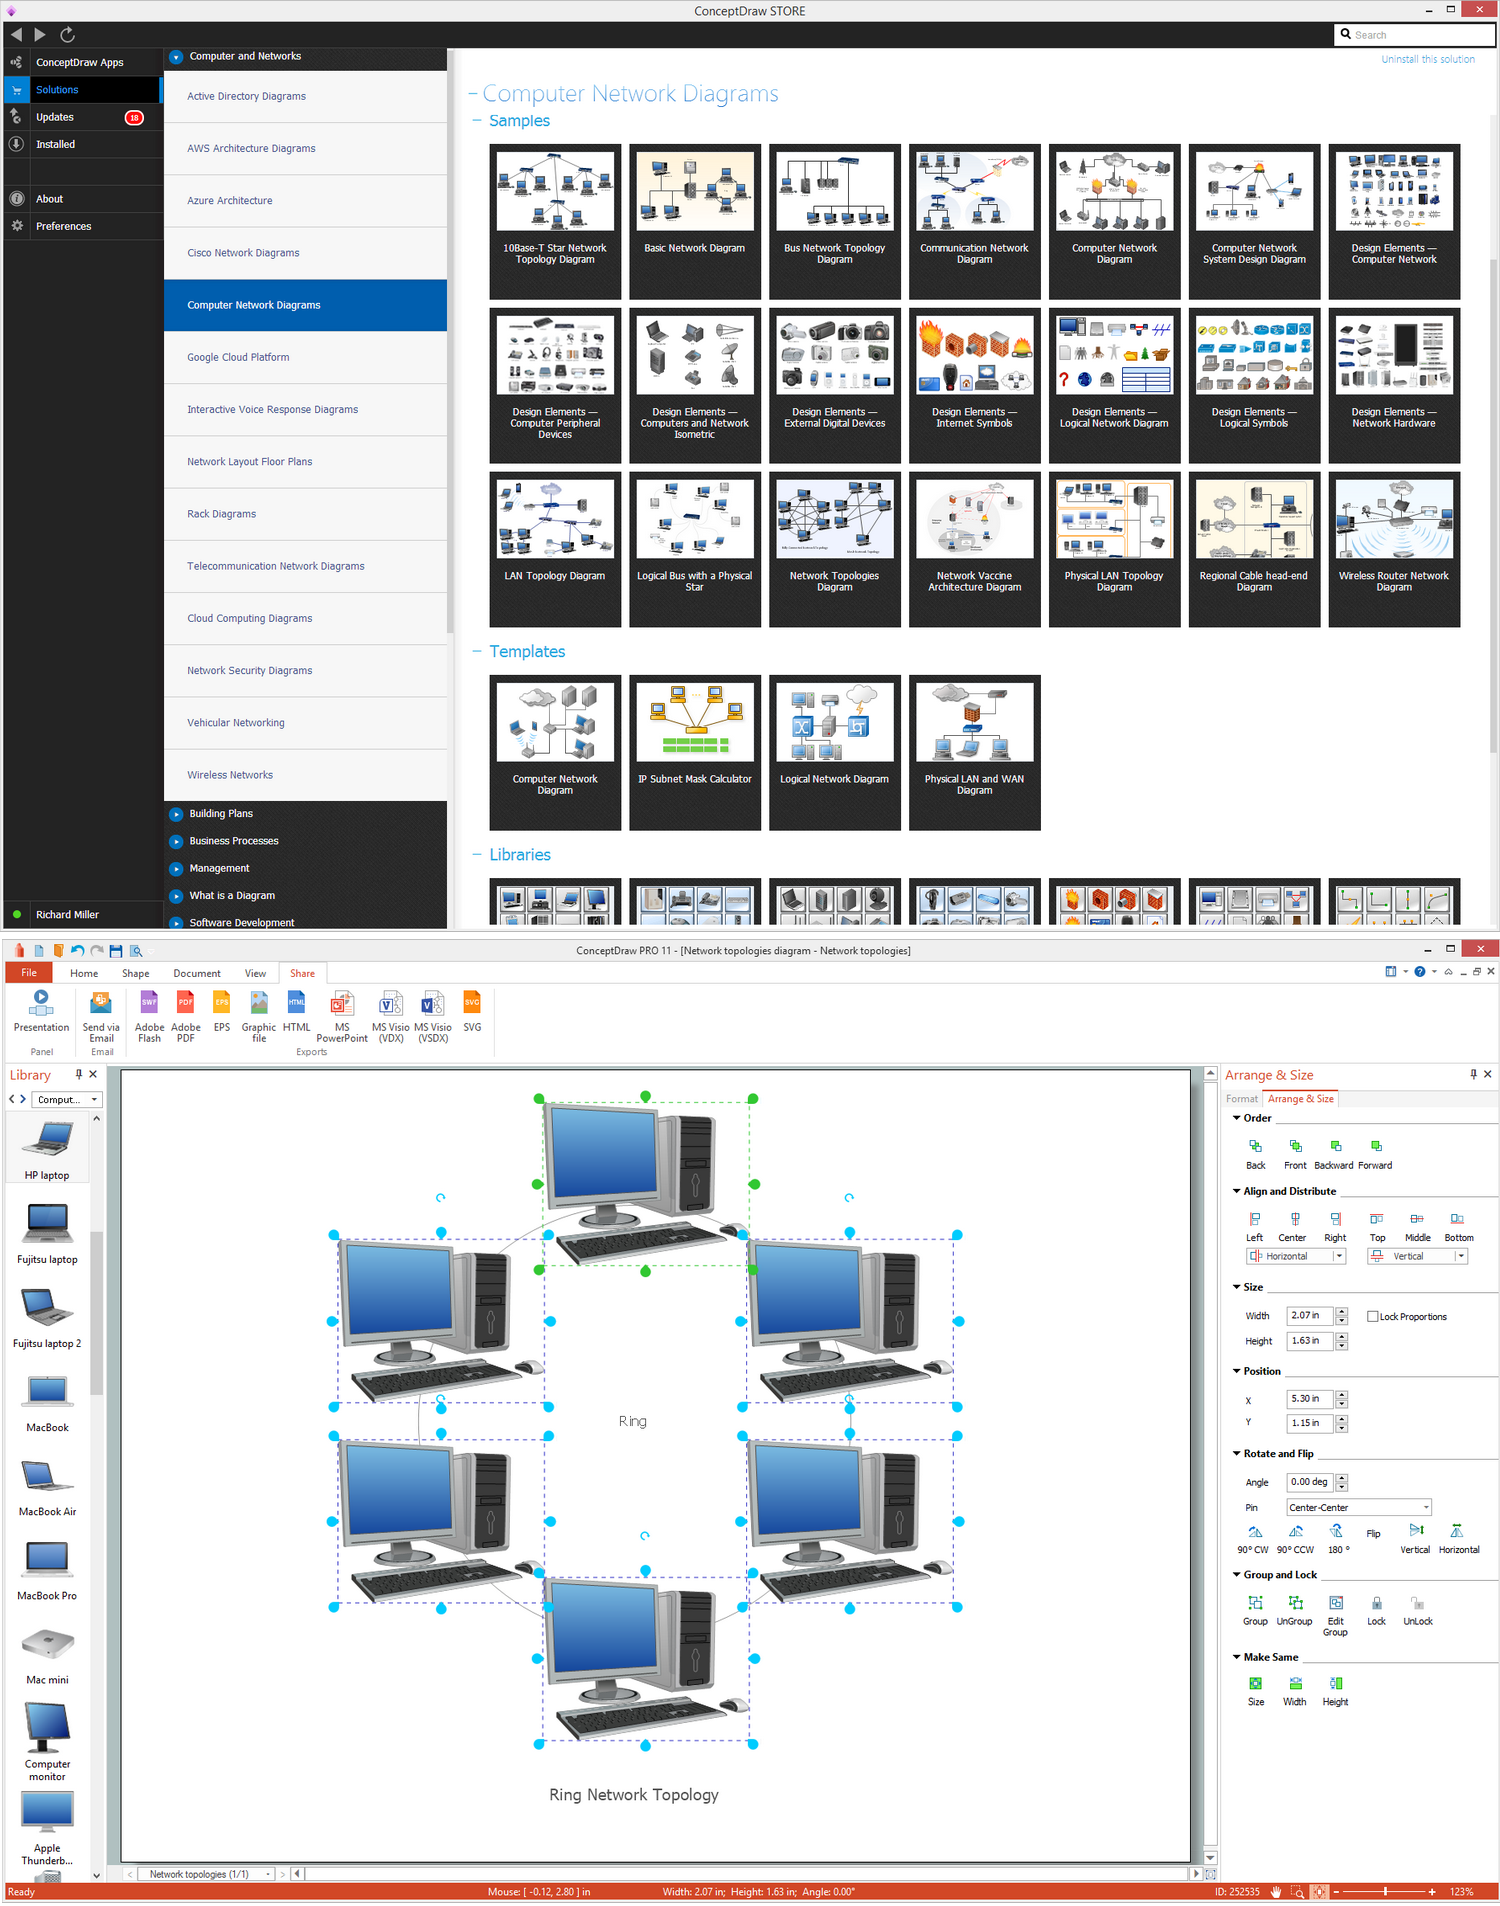
Being involved in such business activity as business architecture, you may find ConceptDraw DIAGRAM diagramming and drawing software a useful tool for making only good looking as well as smart looking illustrations as it is one of the best applications nowadays, in a line with another product of CS Odessa — ConceptDraw STORE.
There’s a Business Architecture Working Group of the Object Management Group which appeared in 2010, known to be describing business architecture as "a blueprint of the enterprise”, known to be providing some common understanding of some organization, used for aligning the tactical demands and the strategic objectives. People who work on developing and maintaining any business architecture are known to be called as the “business architects”. Such people may find Enterprise Architecture Diagrams Solution from ConceptDraw STORE a very helpful one for getting all the necessary tools for making the business architecture related drawings using ConceptDraw DIAGRAM
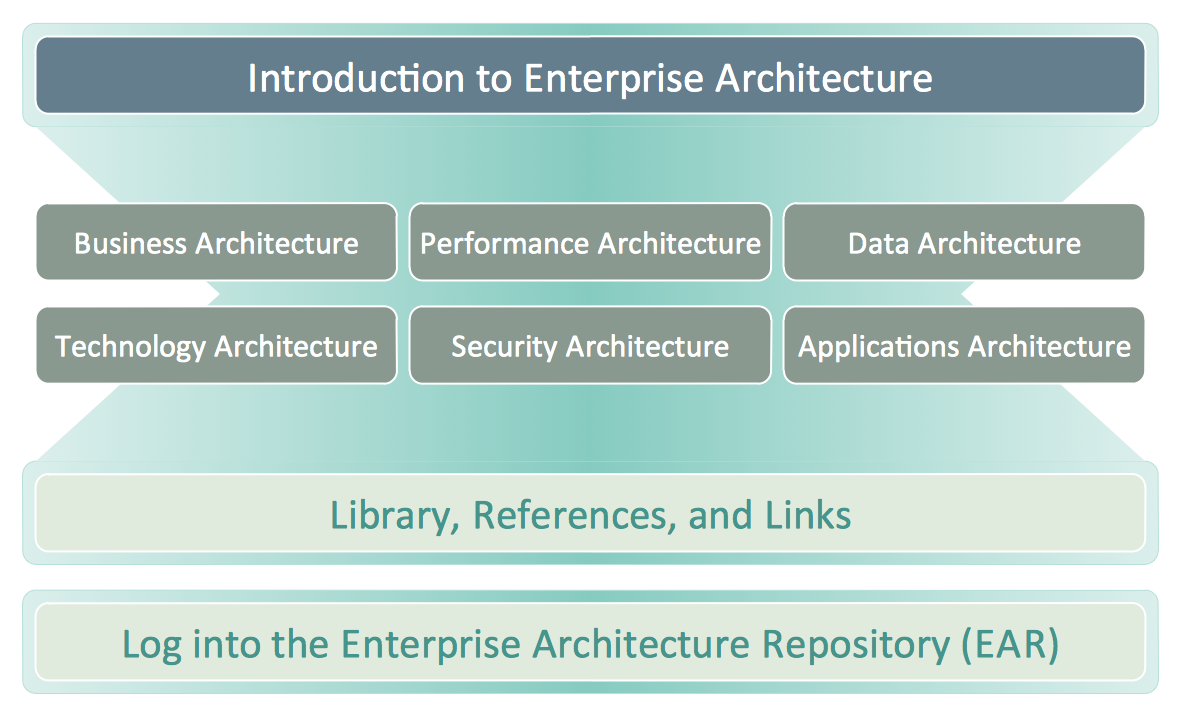
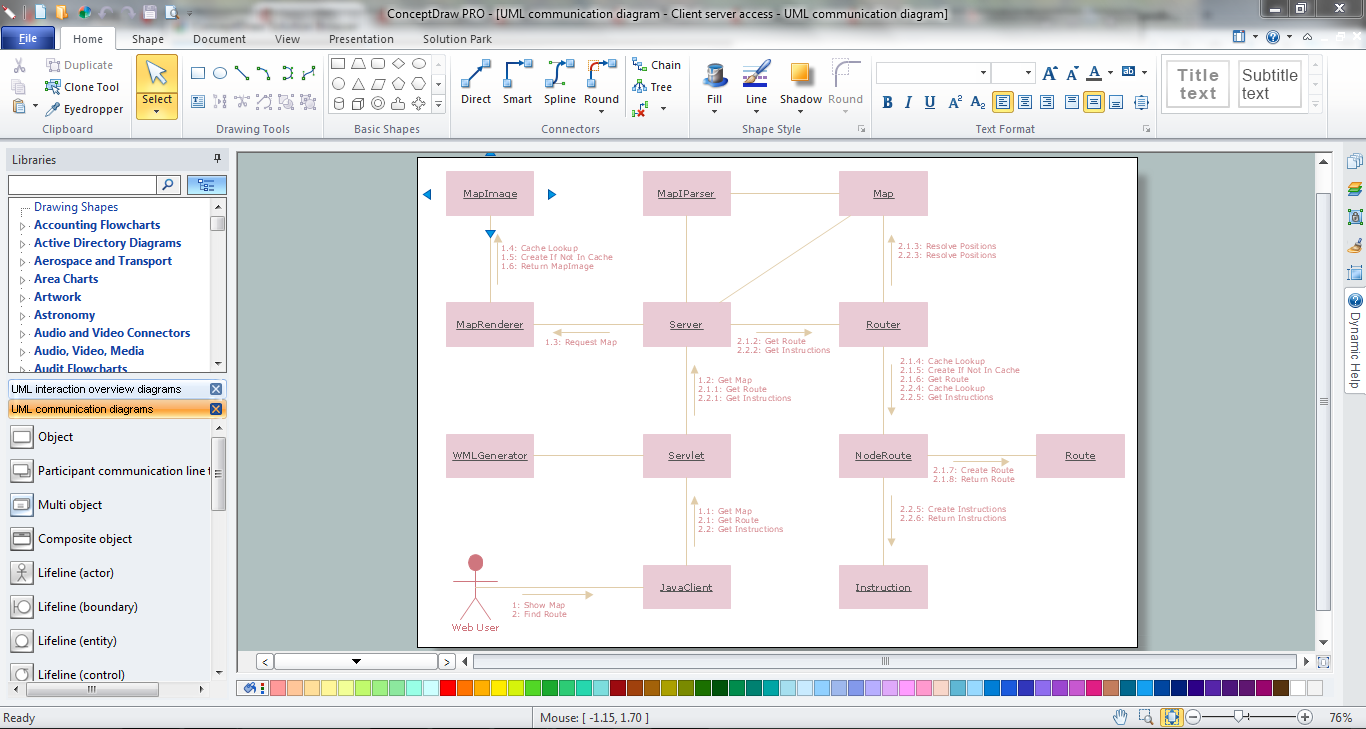
Example 1. Business Architecture — USDA Enterprise Architecture
Business architecture is sometimes called as “the bridge between the enterprise strategy and the enterprise business model as well as the business functionality of any enterprise” where it is used. The term of the "business architecture" itself can be also used for meaning some architectural description of some enterprise or of some business unit, some profession or some architectural model. According to the Object Management Group, which was already mentioned before, a blueprint of one of the types of business architecture describes "the structure of the enterprise in terms of its governance structure, business information and business processes".
The profession of business architecture is known to be focused on the operational, motivational and analysis frameworks, linking the mentioned aspects of the enterprise all together. The major characteristic of any business architecture: it is known to be representing real world aspects of some business, describing the way they interact with each other. Any business architecture is developed by some practice area, usually interdisciplinary, which is known to be focused on such processes (as well as the results of such processes) of defining and analysing the usual numerous concerns of what exactly business does, in what way it works, in what way it is organized, etc.
Business architecture is also used for designing the competitive structures and numerous processes, leveraging the already existing strengths, identifying the potential investment opportunities which all known to be advancing the business’s objectives, driving innovation. All the products of any business architecture efforts can be used for developing plans, making business decisions as well as guiding any implementations.
Any business architecture effort can be conducted on its own as well as in a way of a part of some enterprise architecture (you can find more information about enterprise architecture in other articled on this site simply going to the “Search” button on the top right corner). An enterprise architecture was very popular in the past, being focused mainly on the technological aspects of change. Such practice was very fast evolving using a business architecture approach for addressing the organizational as well as motivational aspects of change.
The comparison between such terms as “business architecture” and “enterprise architecture” is simply a natural architectural comparison of two related disciplines, as any business architecture is known to be representing some business in the absence of any internet technology architecture and any enterprise architecture is known to be providing an overarching framework for business and internet technology architecture.
To make it possible to develop some particular integrated view of some enterprise, there are many different views of some organization, which are usually developed. Each of such "views" is usually a simple diagram, illustrating a way of understanding the enterprise in a way of highlighting the specific information about it. The main views of any enterprise address several aspects of the enterprise, which were summarized by the Object Management Group in 2012, including such statements as any “Business Strategy view captures the strategic and tactical goals which drive any organization forward”, etc. One of the other statements is that the Business Capabilities view may describe the major business functions of any enterprise as well as its pieces, known to be performing the mentioned functions.
The Value stream view can be defining the so-called “end-to-end” set of different activities which are known to be delivering a value to both external and internal stakeholders. Any Business Knowledge view can establish the customers, orders, suppliers, etc., within some particular organization as well as all the relationships between the mentioned semantics, such as customers names, orders dates, suppliers names, etc.

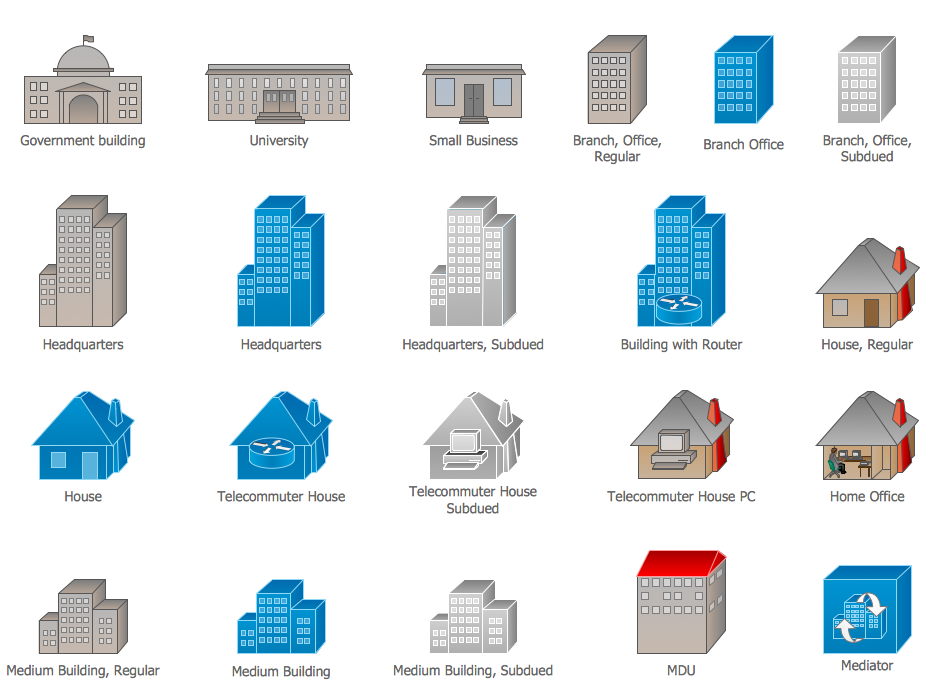
Example 2. Enterprise Architecture Diagrams Library Design Elements
Any business strategy can consist of such elements as strategy statements, applied and/or generic business models, organizational objectives and goals and others. Any strategic statements are known to be arranged and analysed in a hierarchical way, with help of different techniques, such as well known qualitative hierarchical cluster analysis that always can be illustrated with help of ConceptDraw DIAGRAM Based on the mentioned hierarchy the initial business architecture can be further developed, using general methods as well as a business administration theory.

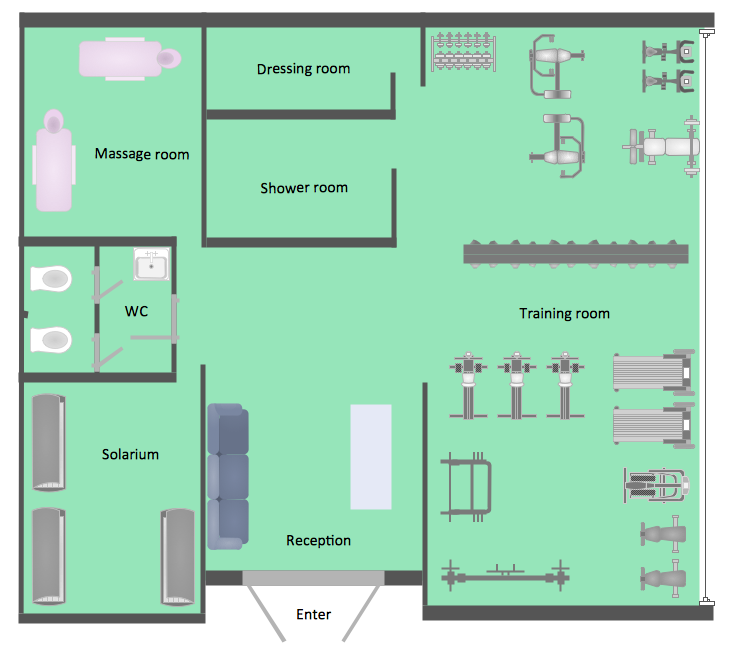
Example 3. Business Architecture
The drawings which can be related to the described field of business activity, can always be simply created in ConceptDraw DIAGRAM diagramming and drawing software with a usage of ConceptDraw STORE application that is known to be providing numerous “solutions” with the pre-made examples and templates, which all can be used as the drafts for all the ConceptDraw DIAGRAM users.
TEN RELATED HOW TO's:
Creating diagrams and schemes is a pleasure with proper software. You don’t need any additional skills to create organizational chart quick and effectively with our diagramming tool. Create your ConceptDraw account today and start your diagramming experience.
This is the most regular type of organizational chart - hierarchical. It is created using the ConceptDraw Organizational Charts solution. Its composition can be displayed as a pyramid, with an only person in authority at the top, with sub-levels of management below them. According to hierarchy, an employee communicates only to his immediate head or subordinates. A hierarchical organizational structure may be choice for a businesses that work on multiform markets or any other organization that has a workflow requiring a multilevel structure of middle management.
Picture: Create Organizational Chart
Related Solution:
The ConceptDraw Flowchart component includes a set of samples and templates. This geathered as flowchart maker toolbox which focused on drawing flowcharts of any industry standards.
Picture: Flowchart Components
Related Solution:
UML Composite Structure Diagram shows the internal structure of a class and the possible interactions at this structure.
Picture: Diagramming Software for UML Composite Structure Diagrams
When trying to figure out the nature of the problems occurring within a project, there are many ways to develop such understanding. One of the most common ways to document processes for further improvement is to draw a process flowchart, which depicts the activities of the process arranged in sequential order — this is business process management. ConceptDraw DIAGRAM is business process mapping software with impressive range of productivity features for business process management and classic project management. This business process management software is helpful for many purposes from different payment processes, or manufacturing processes to chemical processes. Business process mapping flowcharts helps clarify the actual workflow of different people engaged in the same process. This samples were made with ConceptDraw DIAGRAM — business process mapping software for flowcharting and used as classic visio alternative because its briefly named "visio for mac" and for windows, this sort of software named the business process management tools.
This flowchart diagram shows a process flow of project management. The diagram that is presented here depicts the project life cycle that is basic for the most of project management methods. Breaking a project into phases allows to track it in the proper manner. Through separation on phases, the total workflow of a project is divided into some foreseeable components, thus making it easier to follow the project status. A project life cycle commonly includes: initiation, definition, design, development and implementation phases. Distinguished method to show parallel and interdependent processes, as well as project life cycle relationships. A flowchart diagram is often used as visual guide to project. For instance, it used by marketing project management software for visualizing stages of marketing activities or as project management workflow tools. Created with ConceptDraw DIAGRAM — business process mapping software which is flowcharting visio alternative or shortly its visio for mac, this sort of software platform often named the business process management tools.
Picture: Process Flowchart: A Step-by-Step Comprehensive Guide
Related Solution:
ConceptDraw DIAGRAM is the professional business graphic software for drawing diagrams and charts with great visual appeal on Mac OS X.
Picture: The Best Drawing Program for Mac
Related Solution:
Event-Driven Process chain Diagrams for improvement throughout an organisation. Best software for Process Flow Diagram. The Event-driven Process Chain (EPC) Diagrams allows managers to plan processes and resources.
Picture: Business process Flow Chart — Event-Driven Process chain (EPC) diagrams
Related Solution:
Being involved in the process of planning some system of interacting the objects, or in other words, being engaged in the object-oriented design in order to solve some software problem as one of the approaches used in the software design, you may find the ConceptDraw DIAGRAM diagramming and drawing software a really useful tool for making the needed drawings, such as the IDEF Business Process Diagrams.
Picture: Object-Oriented Design
Related Solution:
ConceptDraw DIAGRAM system design software is a product of CS Odessa that was developed especially for making it much simpler to create all the needed diagrams, charts, flowcharts, schemes and other drawings when there is such a need in it. Having the Specification and Description Language (SDL) solution installed from the ConceptDraw STORE application may be another bonus to any ConceptDraw DIAGRAM diagramming and drawing software’s user as it offers both stencil libraries with the design elements and the pre-made examples of the diagrams, such as the SDL ones.
Picture: System Design
Related Solution:
The Microsoft Windows Azure platform is a highly flexible cloud-based solution with variety of services which supports not only the execution of.NET applications, but also allows developers to use programming languages like Java, PHP, Node.js, or Python.
ConceptDraw DIAGRAM diagramming and vector drawing software provides the Azure Architecture Solution from the Computer and Networks area of ConceptDraw Solution Park with a lot of useful tools which make easier: illustration of Windows Azure possibilities and features, describing Windows Azure Architecture, drawing Azure Architecture Diagrams, depicting Azure Cloud System Architecture, describing Azure management, Azure storage, documenting Azure services.
Picture: Windows Azure
Related Solution:
Software development flourishes nowadays. Students have tons of educational information and courses that would fit every taste. And it's no secret that knowing how to draw data flow diagrams is a useful skill for a future software architect. The diagrams help a lot in understanding how to storage data effectively and how data processes within a system.
This data flow diagram represents the model of small traditional production enterprise. It was created using Yourdon and Coad notation. The data flow diagram include four main objects: entity, process, data store and data flow. Yourdon and Coad notation uses circles to depict processes and parallel lines to represent data stores. Dataflows are shown as arrowed lines. They are labeled with the description of the data that move through them. Dataflow's role is to deliver the pieces of information. A process's function is to transform. the input data flow into output data flow. ConceptDraw Data Flow Diagrams solution contains the data flow diagram symbols of both Yourdon-Coad and Gane-Sarson notations and a set of handy templates to get started with DFD.
Picture: Data Flow Diagrams
Related Solution: