Sample 1. Flow Charts
With ConceptDraw Office ConceptDraw DIAGRAM provides you with the tools you need to generate reports documentation and presentations that entirely reflect project performance.
Comprehensive tools for information visualization
Vector Drawing Tools
The huge set of vector drawing tools can compete with any professional illustration program. Customizable Grid and Snap tools help to position your shapes precisely. Alignment, Distribution and Make Same tools will automate routine operations with multiple shapes.
Libraries and Cliparts
Wide collections of shapes and Cliparts help you create a different types of diagrams, such as Business Process, Network Diagram, Organization Chart as well as various sorts of technical drawings.
Smart Connectors and Custom Connection Points
Lines stay linked to their shapes, so you don't need to redraw your diagram every time you move something. Smart connectors can follow shapes around, as well as display gaps or bridges where they cross other connectors. Every shape can be turned into a connector. You can easily add connection points to any part of the shape.
Layers and Texture fill
You can use unlimited number of layers to organize related shapes in one document page. Use one of the preset textures fill to create professionally looking objects.
Presentation mode
With Presentation Mode you can perform an attractive full screen presentation from ConceptDraw documents without a need to use any special application.
TEN RELATED HOW TO's:
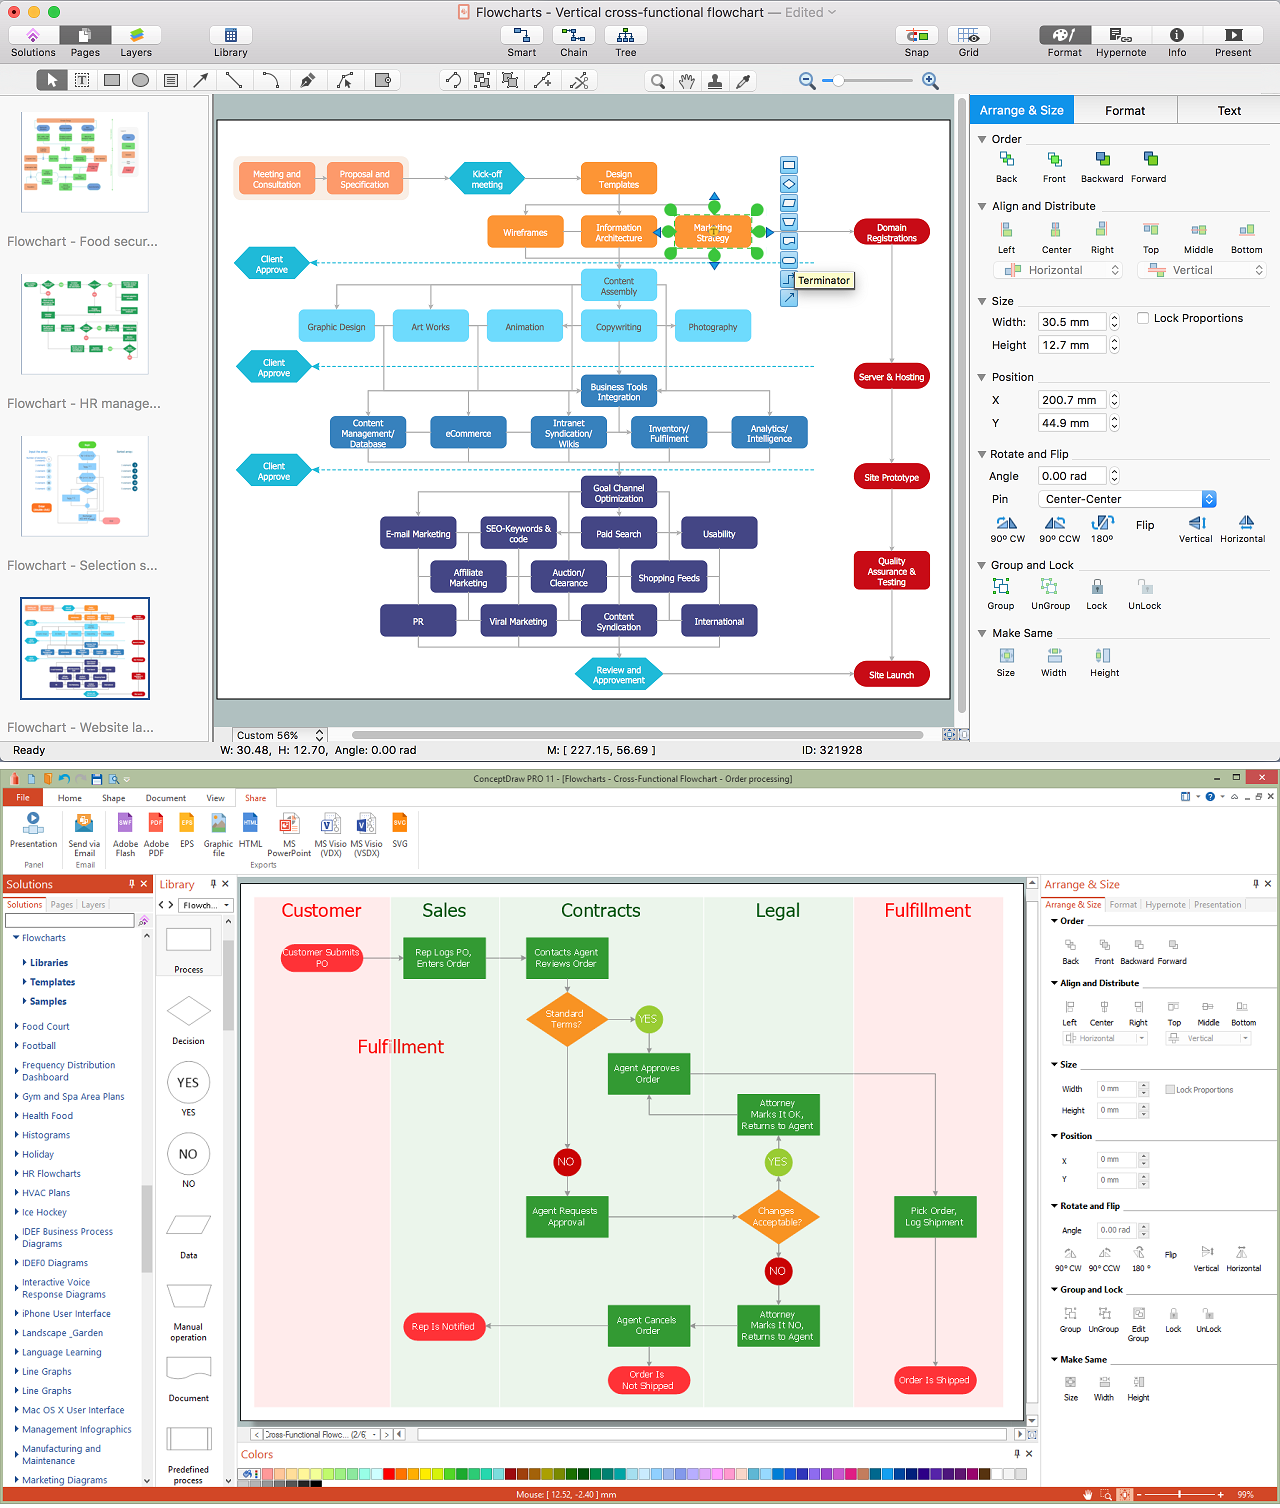
The Flowchart is a very popular type of diagram, it is widely used for analyzing, designing, managing and visualizing the business and technical processes, various software algorithms. But how to create Flowchart quick and easy?
Flowcharts solution from the Diagrams area of ConceptDraw Solution Park helps you to design the professional looking Flowchart Diagrams quick and easy using the ConceptDraw DIAGRAM diagramming and vector drawing software.
Picture: Create Flowchart - Making a Flowchart
Related Solution:
In the case of origin of an emergency is very important to have a correct, clear and comprehensible action plan which will help you to react quicker and to make right decisions. ConceptDraw DIAGRAM software extended with Fire and Emergency Plans solution from the Building Plans Area of ConceptDraw Solution Park provides extensive drawing tools for quick and easy creating fire and emergency plans, and also a set of various templates and samples, among them the Emergency Action Plan Template.
Picture: Emergency Action Plan Template
Related Solution:
The visual form of mind maps is helpful in all stages of quality management, from describing problem to describing and documenting a decision.
Picture: Quality Project Management with Mind Maps
Related Solution:
Tool to draw Metro Map styled inforgraphics. London Tube map sample.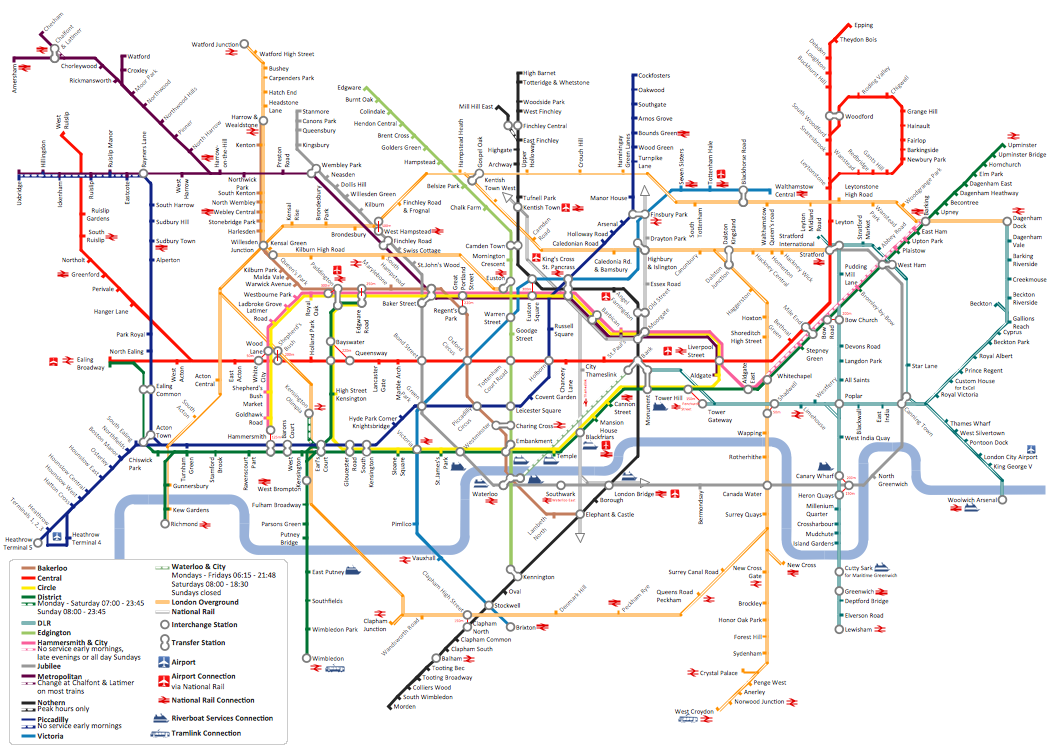
Picture: How to draw Metro Map style infographics? (London)
Related Solution:
The innovative ConceptDraw Arrows10 Technology included in ConceptDraw DIAGRAM is a powerful drawing tool that changes the way diagrams are produced.
While making the drawing process easier and faster.
This is more than enough versatility to draw any type of diagram with any degree of complexity.
Picture: How to Dramatically Reduce Drawing Time - New connection modes
Collaborating with co-workers is very important, not only in order to get things done effectively, but also to keep in touch with the outside world. Great way for business collaboration is Skype.
Picture: Online Collaboration via Skype
Related Solution:
Functional modeling allows to make complex business processes simple. One of the basic methods is IDEF0 and one of the most effective also. To create a business model, use flowchart symbols.
The IDEF0 library, supplied with ConceptDraw IDEF0 Diagrams solution contains 18 IDEF0 basic notation symbols. All symbols are the vector graphic images what means, that one can customize their size preserving the stable quality. Another library of IDEF0 symbols can be find out in the the Business Process Diagrams solution, included to the Business Processes section of ConceptDraw Solution Park. These libraries composed from just vector objects and are totally compatible. You can apply the IDEF0 symbols from both libraries at your flowcharts, if needed.
Picture: IDEF0 Flowchart Symbols
Related Solution:
The vector stencils library IDEF0 Diagram from the solution IDEF0 Diagrams contains specific IDEF0 diagram symbols such as arrow symbols and entity symbols for ConceptDraw DIAGRAM software.
Picture: IDEF0 Diagram
Related Solution:
New Smart connectors in ConceptDraw DIAGRAM now have an auto-routing feature. This means that connectors always find the optimal route between objects and automatically recalculate that path when moving these objects.
You don't have to think about your connectors, they think for you.
Picture: ConceptDraw Arrows10 Technology
If we divide computer networks by scale, we get several main categories. The smallest network is PAN, as it connects personal devices themselves, and as the number of users grows, a local area network can be recognized, and campus area networks (CAN) connects several local networks located within some area like a university or a corporation. Computers connected to CAN share public educational materials and list of CAN network examples includes such prestigious universities like Stanford and Carnegie Mellon.
This is an example of a computer network diagram created for a campus area network. It was created using using ConceptDraw solution for the Computer and Network diagramming. The specific of this sample campus network is its distribution. It is rather broad to embrace a big campus territory. This diagram can be applied as a template for designing custom area network topology diagram for a particular educational institution.
Picture: Campus Area Networks (CAN). Computer and Network Examples
Related Solution:
