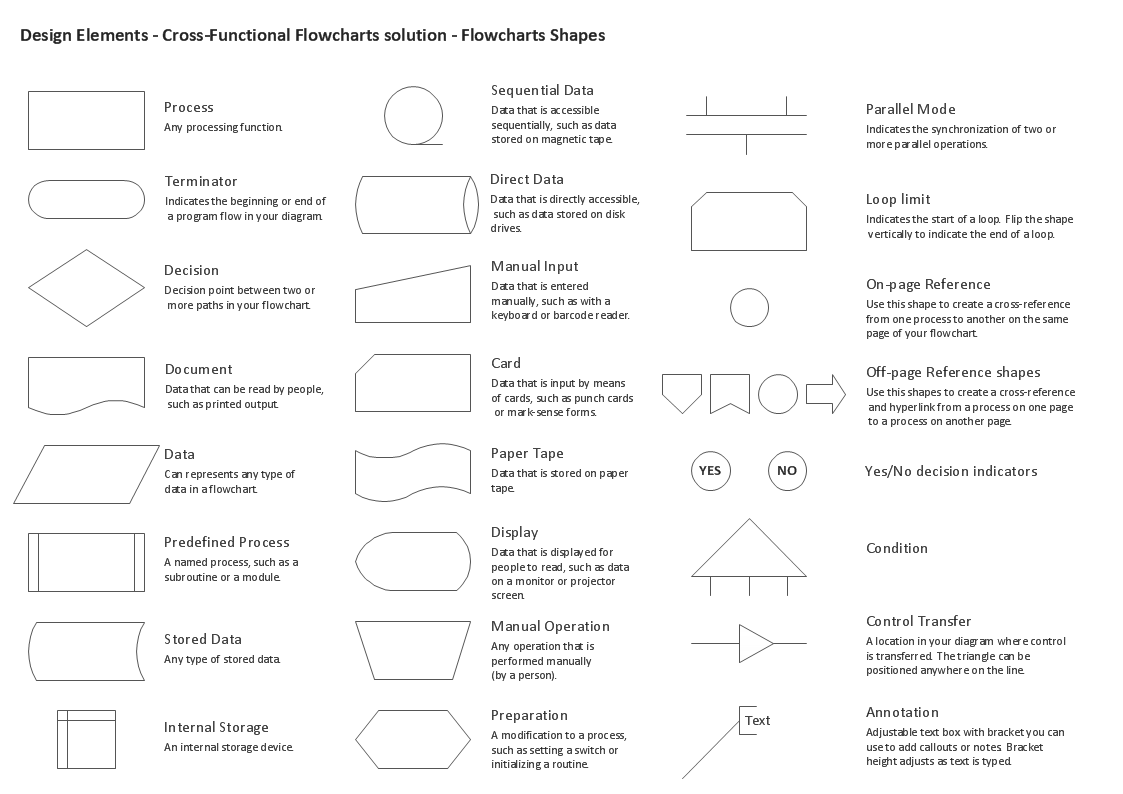
Sample 1. Stencils library - Cross-functional flowcharts.
ConceptDraw DIAGRAM diagramming software provides vector shapes and connector tools for quick and easy drawing diagrams for business, technology, science and education. ConceptDraw Solution Park include professional set of libraries for Cross Functional Flowchart Shapes Stencil.
Use ConceptDraw DIAGRAM enhanced with solutions from ConceptDraw Solution Park to create diagrams to present and explain structures, process flows, logical relationships, networks, design schemes and other visually organized information and knowledge.
NINE RELATED HOW TO's:
Data base diagrams describes inter-related data and tables. It describes roles and relationships, internal and external dependencies, data exchange conventions and structures of knowledge domain.
ConceptDraw Software provides number of data-base chart libraries including major 49 vector symbols. Use these DFD flowchart symbol libraries to design data-base structure and models, use it to design data base process-oriented models, or simple data-oriented models. The are special drawing tools for making data flowcharts, data process diagrams, structured analysis diagrams, and information flow diagrams.
Picture: Database Flowchart Symbols
Related Solution:
A technical drawing of a building is called an architectural drawing. According to a set of conventions, a building drawing includes a number of views, as well as unit measurements, scales, sheet sizes, cross referencing and annotation. Computer progress had a major impact of the methods of architectural drawing, making manual drawing almost obsolete. Digital drawing software, such as ConceptDraw DIAGRAM , offers a number of tools for each design element: piping plan, floor plan, etc.
Any building should have its plumbing and piping plans for every room, that has a water supply. Plans are applied to indicate arrangement of piping system in the building. This diagram presents a suite of standard piping icons for making building plans that include plumbing and piping layout. This diagram was designed using ConceptDraw solution for Piping and Plumbing planning. Using symbols is valuable for making a valid piping plan. Because any professional will properly interpreted such plan as a piece of technical documentation of a construction project.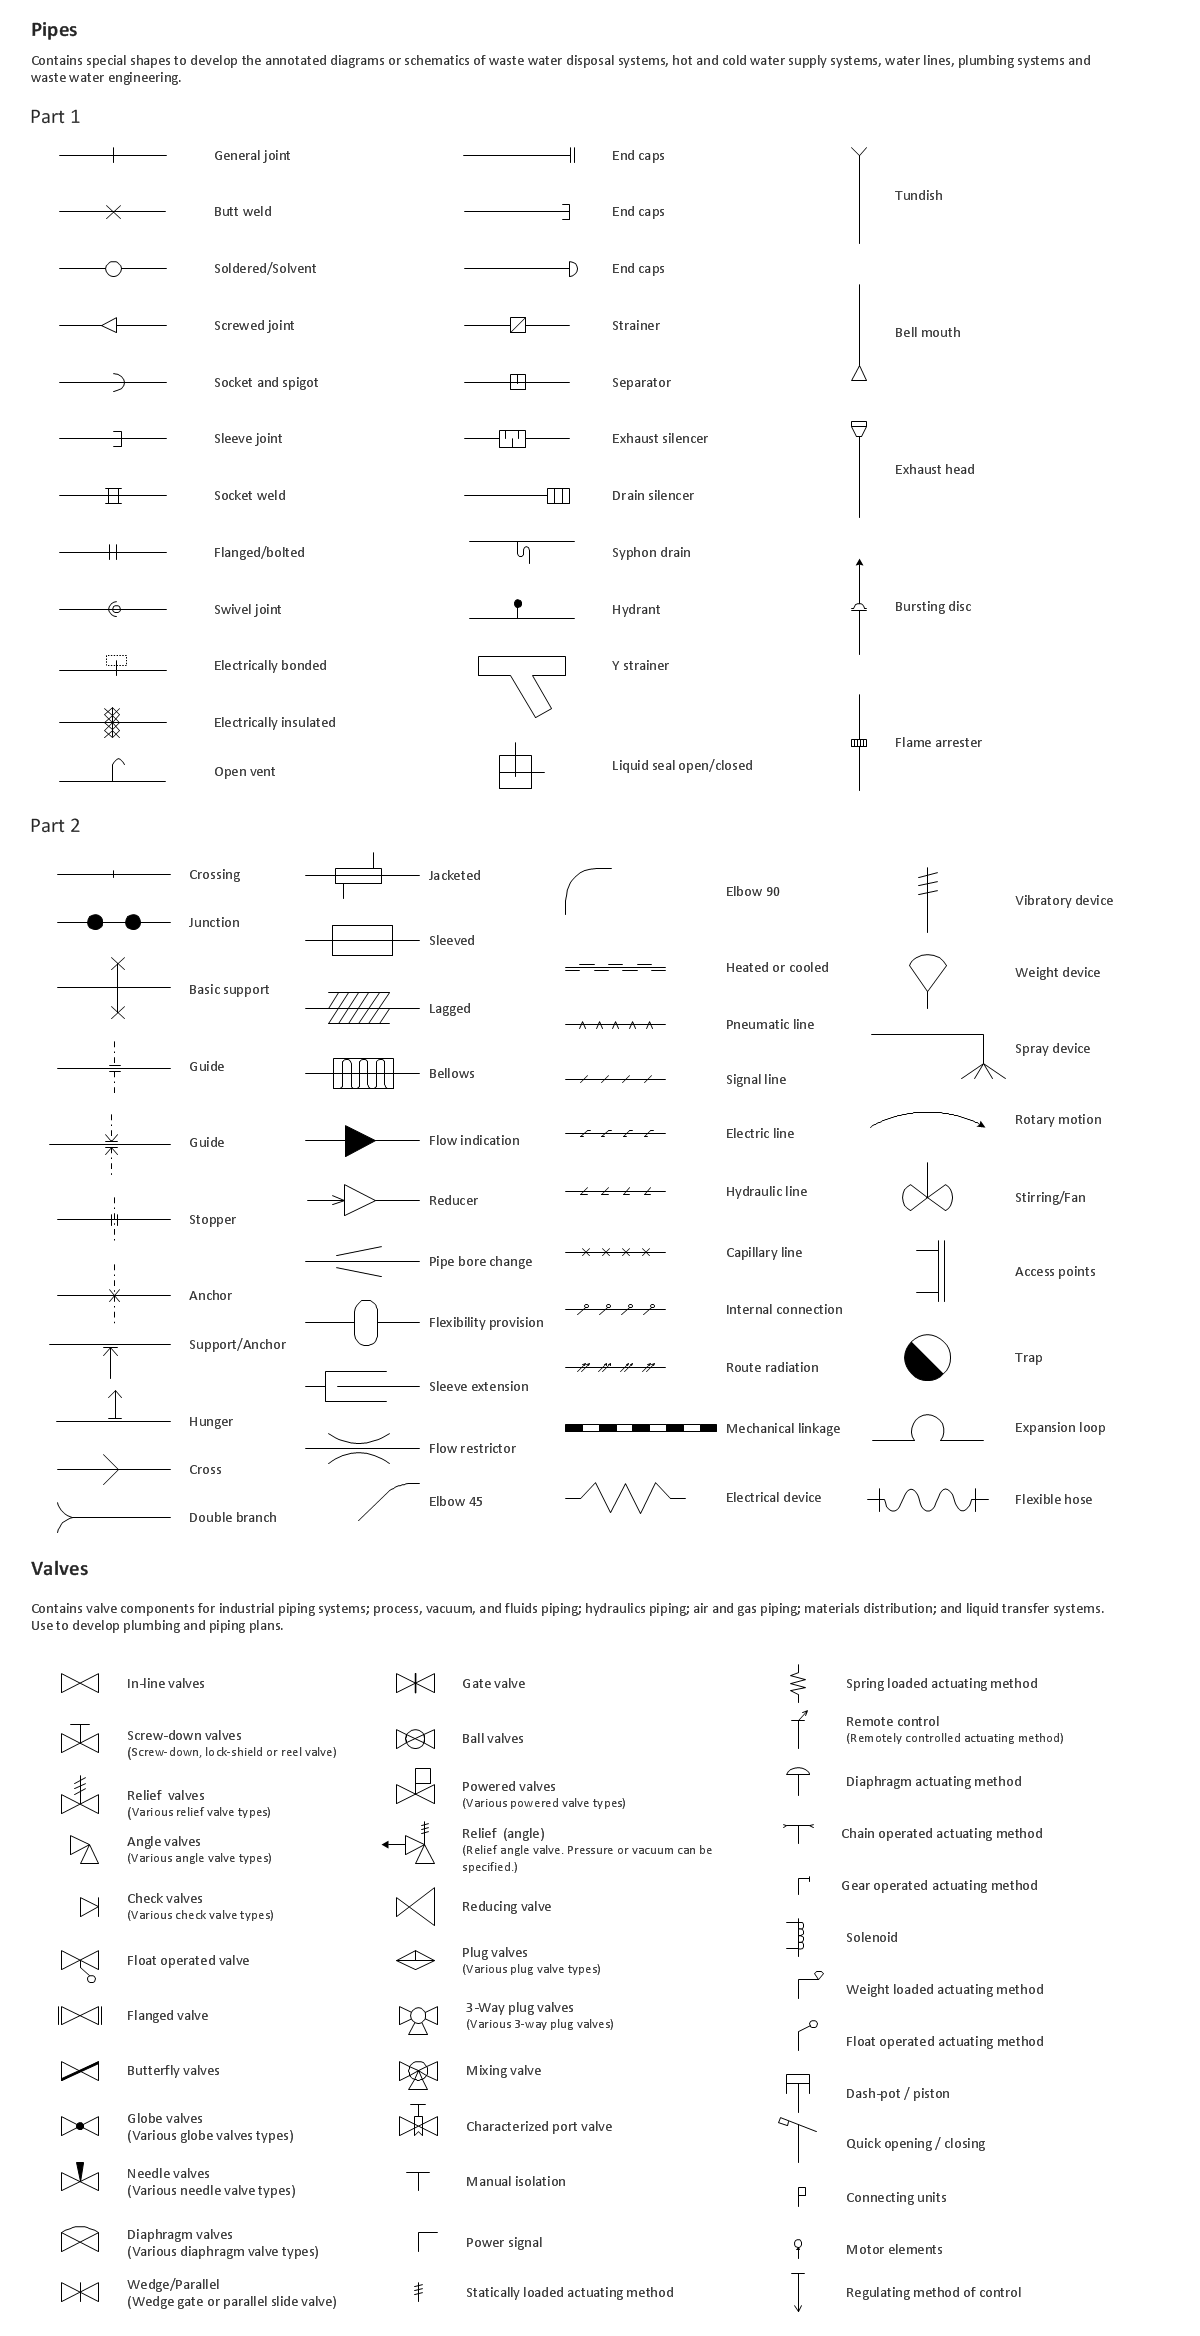
Picture: Building Drawing. Design Element: Piping Plan
Related Solution:
System administrators of the whole world successfully use the Active Directory Domain Services. ConceptDraw DIAGRAM offers the Active Directory Diagrams Solution from the Computer and Networks Area with powerful drawing tools developed specially for all specialists which need create various active directory domain diagrams in their work activity.
Picture: Active Directory Domain
Related Solution:
This sample shows the Influence Diagram. It was created in ConceptDraw DIAGRAM diagramming and vector drawing software using the Basic Diagramming Solution from the Universal Diagramming area of ConceptDraw Solution Park.
Influence diagram represents the directed acyclic graph with three types of nodes and three types of arcs that connect the nodes. Decision node is drawn as a rectangle, Uncertainty node is drawn as an oval, Value node is drawn as an octagon.
Picture: Influence Diagram
Related Solution:
Desbloquee el lenguaje de los diagramas de flujo con nuestra guía de símbolos de diagramas de flujo. 🔸 Todo lo que necesita saber sobre los conceptos básicos del diagrama de flujo, desde ✔️ puntos de decisión hasta ✔️ pasos del proceso, explore el significado detrás de cada símbolo y domine el arte de crear representaciones visuales claras y efectivas de sus procesos.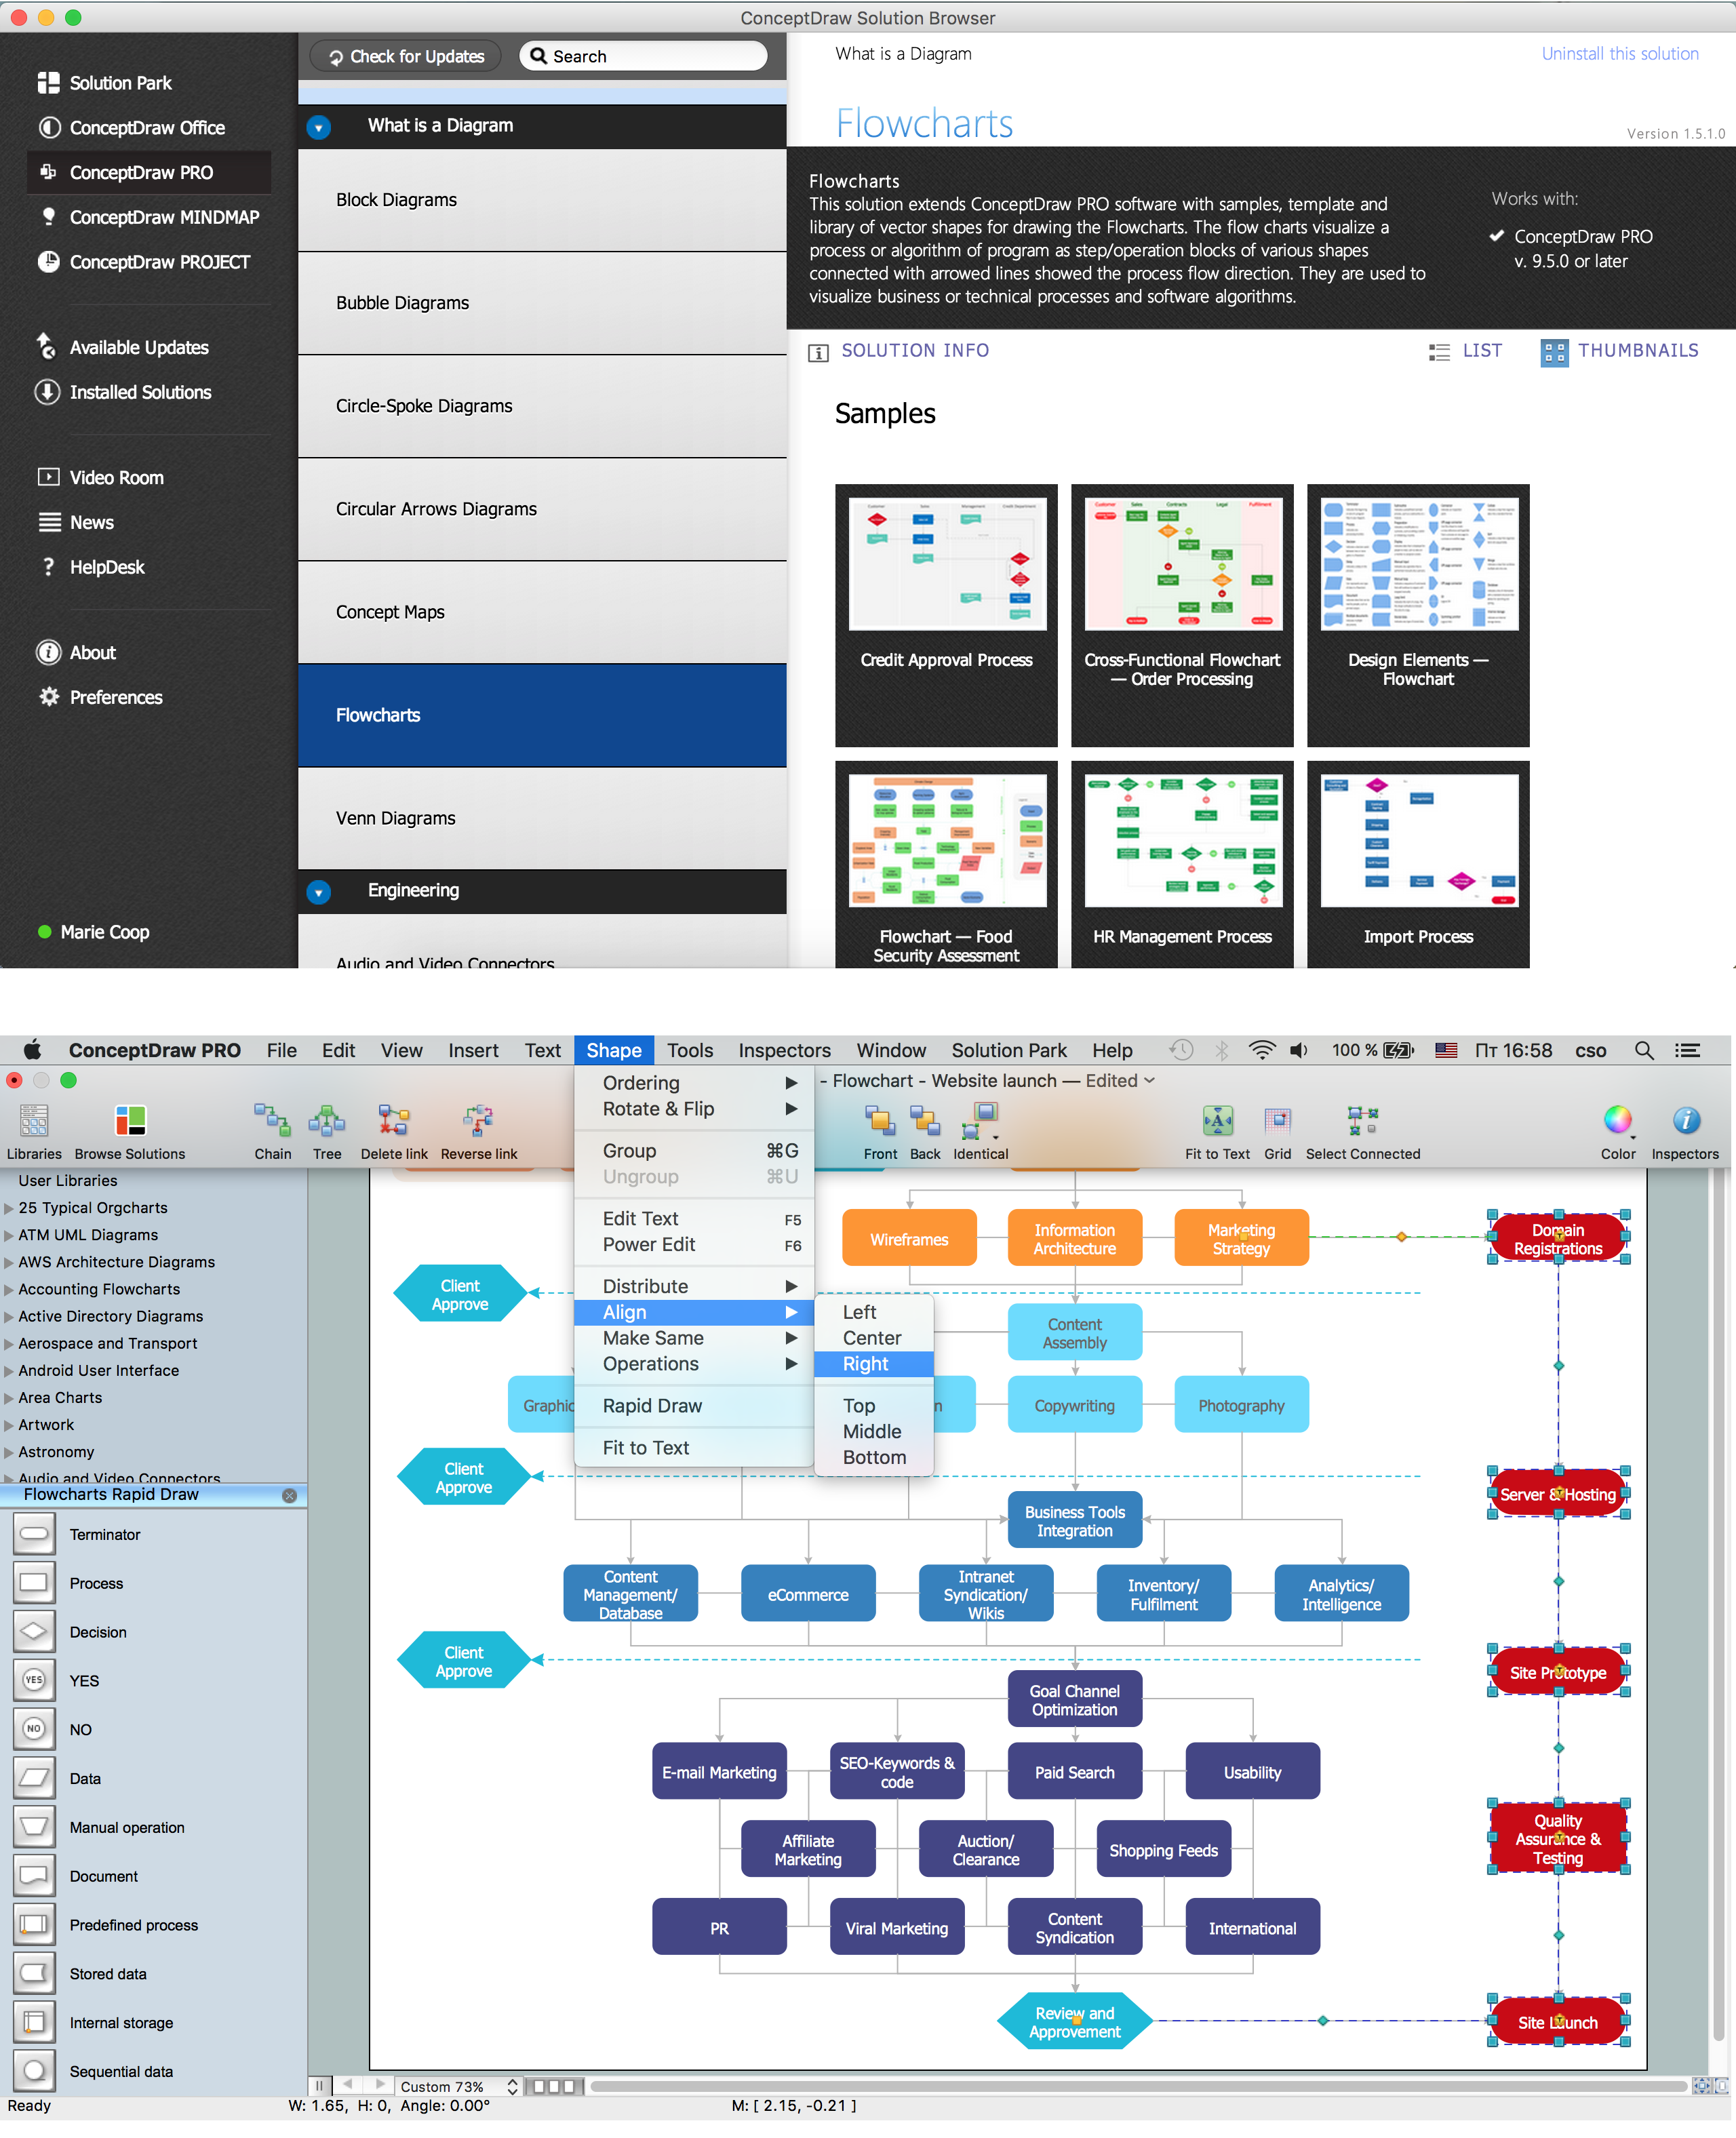
Picture: Symboles Organigramme
Related Solution:
Is it possible to develop a diagram as quickly as the ideas come to you? The innovative ConceptDraw Arrows10 Technology included in ConceptDraw DIAGRAM is a powerful drawing tool that changes the way diagrams are produced.
While making the drawing process easier and faster.
Picture: How to draw a Cross-Functional Flowchart
Related Solution:
If neither of 45 vector shapes of the Cross-Functional Flowcharts solution don't fit your needs, you will want to learn How to create a unique Cross-Functional flowchart.
ConceptDraw Arrows10 Technology - This is more than enough versatility to draw any type of diagram with any degree of complexity.
Drawing software lets you to make horizontal and vertical, audit, opportunity and many more flowcharts.
Picture: How to Create a Cross Functional Flow Chart
ConceptDraw DIAGRAM is perfect for software designers and software developers who need to draw Computer and Network Diagrams._Win_Mac.png)
Picture: Network Diagramming Software for DesignComputer and Network Diagrams
ConceptDraw DIAGRAM is a powerful tool that helps you create professional looking cross-functional flowcharts with the well-designed objects. ConceptDraw DIAGRAM - Drawing Software for Vertical Cross Functional Flowchart. ConceptDraw allows you to focus on work, not the drawing process. ConceptDraw Arrows10 Technology allows to draw connectors with smart behavior that gives flexibility to you during work process.
Picture: Vertical Cross Functional Flowchart