Data Visualization Software Solutions
Sales Dashboard Solution
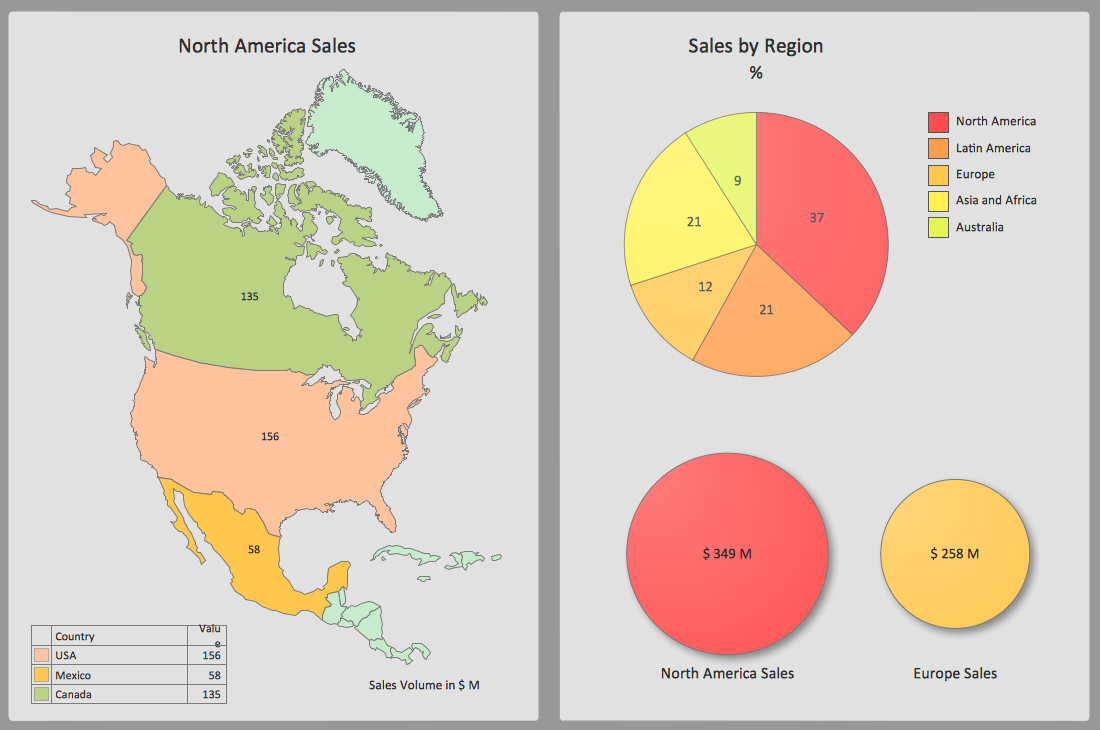
The Sales Dashboard Solution gives users the ability to use live data to drive displays that show sales performance in a wide variety of graphs.
ConceptDraw DIAGRAM is a software for making Live charts and gauges that provide effectiveness to your business. The clean and dynamic dashboards provide views of KPIs relevant to a particular objective or business process (e.g. sales, marketing, human resources, or production).

Pic. 1. Sales KPIs Dashboard Sample
Pic. 1. Sales Dashboard Design Elements
FIVE RELATED HOW TO's:
Visualizing sales data you may need a good example to start. ConceptDraw Sales Dashboard solution delivers a complete set of templates and samples you can use as examples to start composing your own sales dashboard.


Picture: Sales Dashboard Examples
ConceptDraw DIAGRAM is effective software for a variety of activity fields. Now, extended with Sales Flowcharts solution from the Marketing area of ConceptDraw Solution Park it become also useful in the field of sales. It helps to design professional looking Sales Flowcharts, Sales Process Flowcharts, Sales Process Maps, Plans and Diagrams to effectively realize the process of selling a product or service, and to display the sales results.

Picture: Sales Process
Related Solution:
USA Map →
Usually designing of maps, including the USA Map is a quite complex, long and labour-intensive process. But now we have an excellent possibility to make it easier with ConceptDraw DIAGRAM diagramming and vector drawing software extended with powerful USA Maps Solution from the Maps Area of ConceptDraw Solution Park.
Picture: USA Map
Related Solution:
There are lots of ways you can visualize sales data, and the simplest way is using ConceptDraw Sales Dashboard solution for ConceptDraw DIAGRAM. You just need to connect your data to one of pre-designed dashboards, and then you can see dynamic picture of changes.

Picture: Ways You Can Visualize Sales Data
A circuit diagram is sometimes also called an elementary diagram, electronic schematic or electrical diagram circuits. It is essential in construction of any electronic equipment. Among many digital drawing tools available, ConceptDraw DIAGRAM is a leading circuits and logic diagram software, affording for easy and quick creation of even the most advanced and complex diagram designs. This makes it a perfect choice for computer science and any kind of electronic engineering.
This drawing includes the graphic symbols that may be in use while creating a logic circuit diagram. The diagrams of such kind are used in the electronics industry. The logic symbol depicts a device that realizes a Boolean type functions. Practically a logic symbol means transistor, diodes, relays, and other mechanical or optical details which provide function of closing or opening "gates". Totally the logic circuits can involve millions of gates. ConceptDraw Electrical Engineering solution gives the opportunity to create a circuit diagrams both simple and difficult.

Picture: Circuits and Logic Diagram Software
Related Solution:
ConceptDraw
DIAGRAM 18