Constant improvement of key
performance indicators
Constant improvement of key performance indicators that are related to quality is a step in the right direction for a company interested in market growth. There are available tool to lend a fresh look to quality procedures. ConceptDraw MINDMAP has a new addition for the ConceptDraw Solution Park that provides a creative approach to visualizing quality processes, Quality Mind Map Solution.
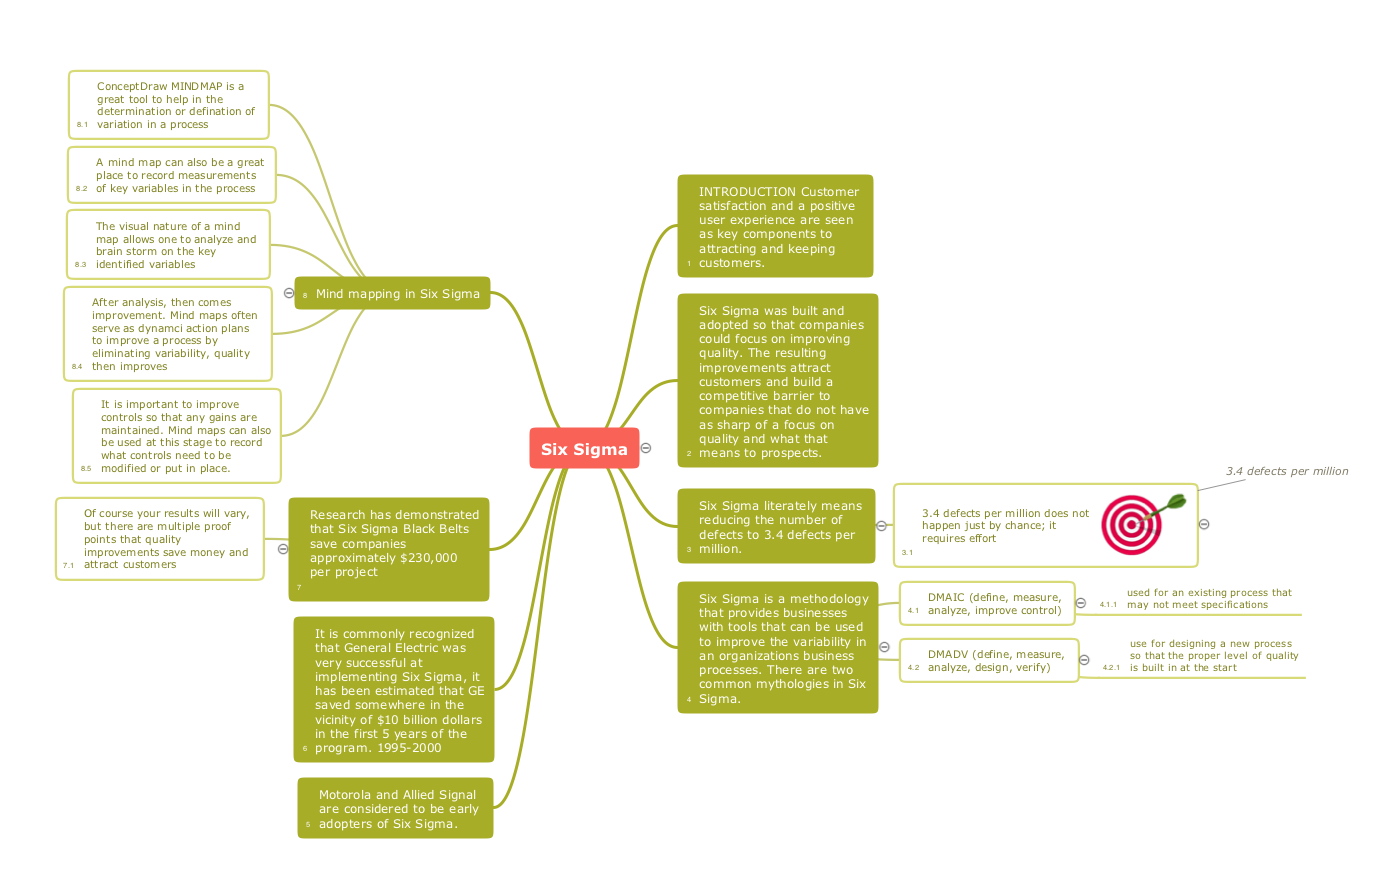
Pic.1 Six sigma - Quality mind map.
You can mindmap your own quality issues for constant improvement of key performance indicators.
See also Samples:
EIGHT RELATED HOW TO's:
Electrical Engineering Solution used together with ConceptDraw DIAGRAM drawing facilities makes short a work of drawing various electrical and electronic circuit schemes. A library of vector objects composed from symbols of Analog and Digital Logic elements of electric circuit includes 40 symbolic images of logic gates, bistable switches of bi-stable electric current, circuit controllers, amplifiers, regulators, generators, etc. All of them can be applied in electronic circuit schemes for showing both analog and digital elements of the circuit.
Electrical Engineering Solution used together with ConceptDraw DIAGRAM drawing facilities makes short a work of drawing various electrical and electronic circuit schemes. A library of vector objects composed from symbols of Analog and Digital Logic elements of electric circuit includes 40 symbolic images of logic gates, bistable switches of bi-stable electric current, circuit controllers, amplifiers, regulators, generators, etc. All of them can be applied in electronic circuit schemes for showing both analog and digital elements of the circuit.
Picture:
Electrical Diagram Symbols F.A.Q.
How to Use Electrical ConceptDraw Diagram Software
Related Solution:
The new Value Stream Mapping solution found in the ConceptDraw Solution Park continues to extend the range of ConceptDraw DIAGRAM into a business graphics tool.
Picture: Value Stream Diagram
Related Solution:
Sharing Documents Trough Skype: Share files, manage projects, inspire ideas, connect people.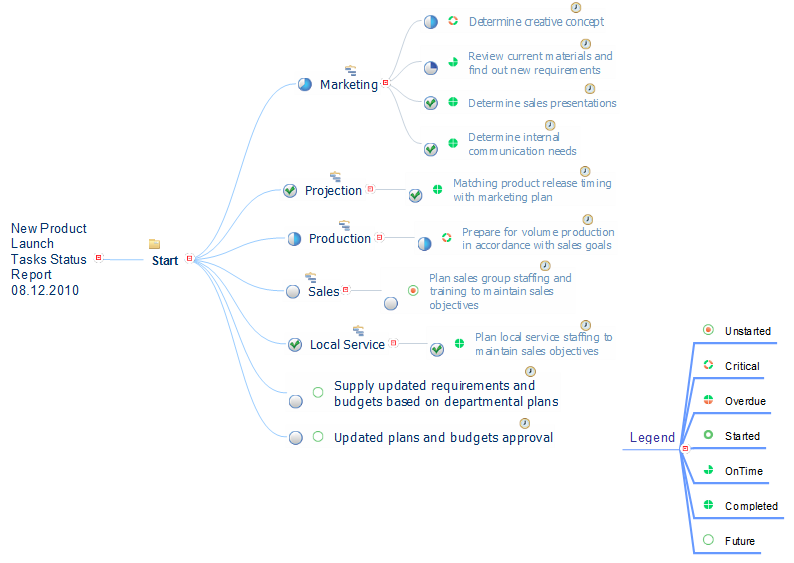
Picture: How to Use Skype for Sharing Documents
Related Solution:
You need to draw the Circular Arrows Diagram, Segmented Diagram or Circular Flow Diagram? Any of these diagrams can be fast and easy designed in ConceptDraw DIAGRAM software, which offers the Business Diagrams Solution from the Management Area with extensive drawing tools, predesigned samples and circular flow diagram template. The use of ready template is the easiest way of drawing.
Picture: Circular Flow Diagram Template
Related Solution:
Sales dashboard is a tool that provides the answers to all questions your sales team may have. A mature sales dashboard provides complete set of KPI to shows corporate, team or personal performance to keep sales process clear.
Picture: A KPI Dashboard Providesthe Answers Your Sales Team
Quality Management Mind Maps - Presentations, Meeting Agendas, Problem will be solved.
The visual form of mind maps is helpful in all stages of quality management, from describing problem to describing and documenting a decision.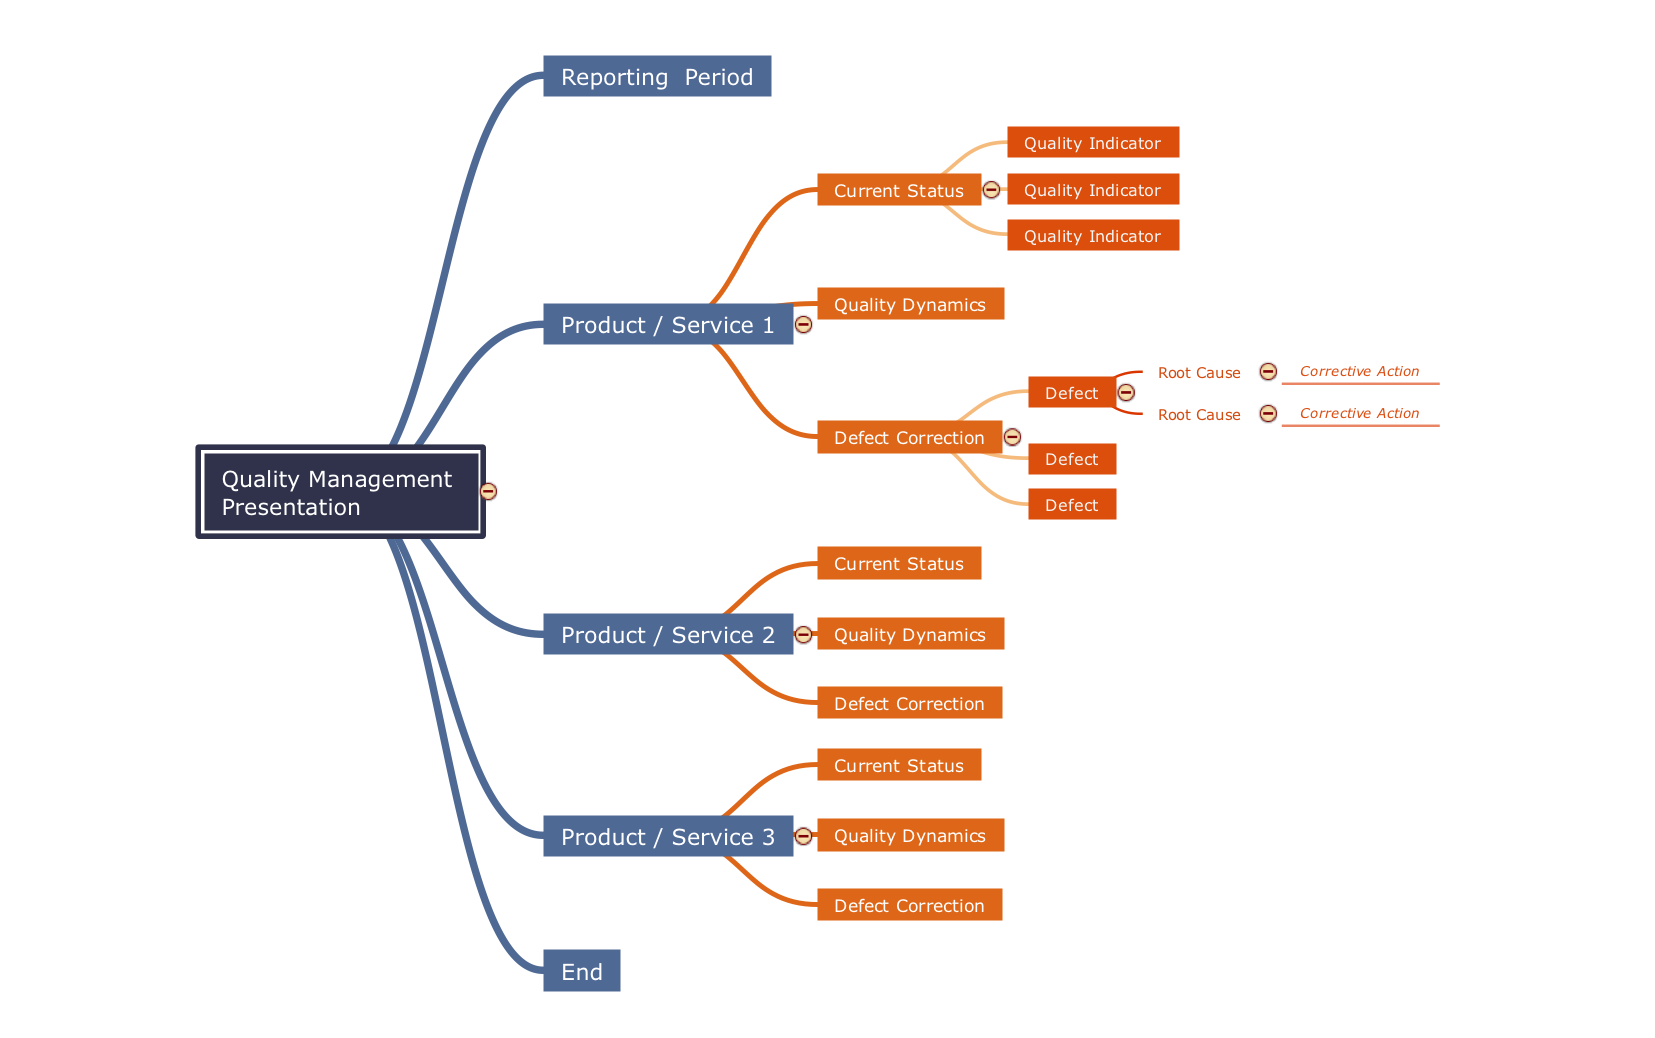
Picture: Quality Criteria MindMap
Related Solution:
The Quality Mind Map Solution extends ConceptDraw MINDMAP with the addition of a number of Quality Management Mind Maps (Presentations, Meeting Agendas, and problem-solving techniques).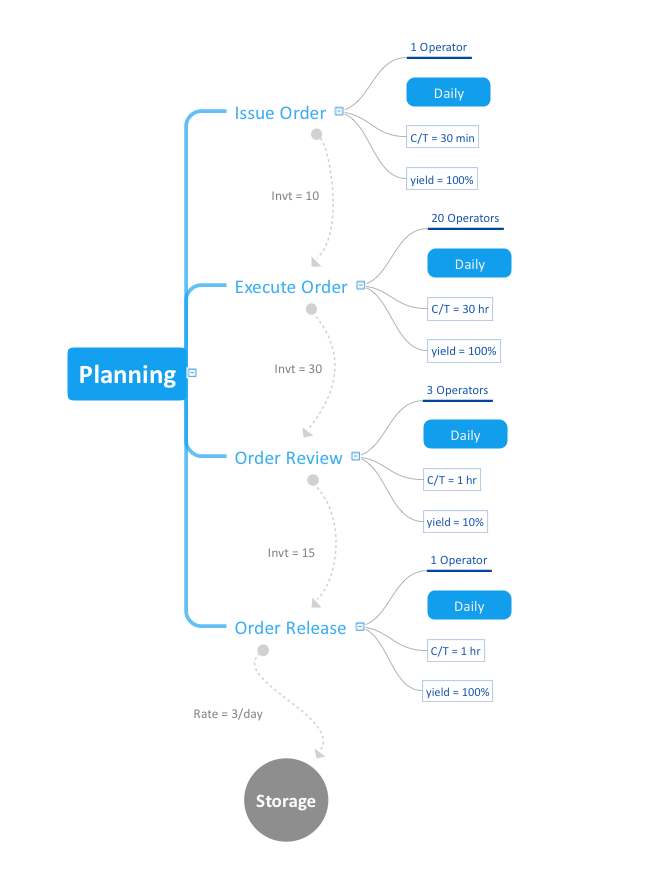
Picture: Quality Mind Map Solution
Related Solution:
Succeed with ConceptDraw DIAGRAM and ConceptDraw MINDMAP software in ✔️ SWOT analysis, ✔️ creating visually appealing SWOT Matrices and SWOT Mind Maps, ✔️ strategic planning, ✔️ decision-making, ✔️ risk management, ✔️ market positioning, ✔️ company development, ✔️ identify emerging trends and customer needs, ✔️ identifying and eliminating external challenges, ✔️ communication and collaboration, ✔️ resource allocation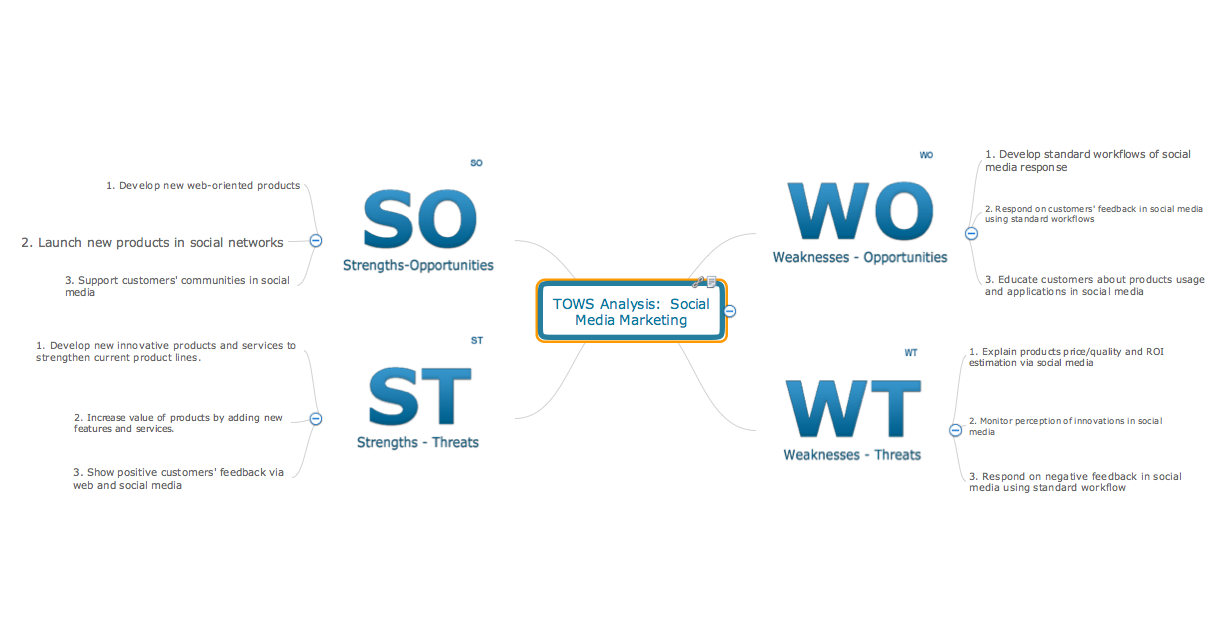
Picture: SWOT Analysis Marketing Tool: A Comprehensive Guide
ConceptDraw
MINDMAP 16