Sales Dashboard
Sales Dashboard is a useful and visual way of representing sales performances, tracking and analyzing sales. It gives a clear picture about the business development success and sales growth progress.
ConceptDraw DIAGRAM software extended with Sales Dashboard solution from the Marketing area of ConceptDraw Solution Park is effective for visualizing sales data, all set of KPIs on the Sales Dashboard with purpose to see how your business develops and to make conclusions for improvement the sales.
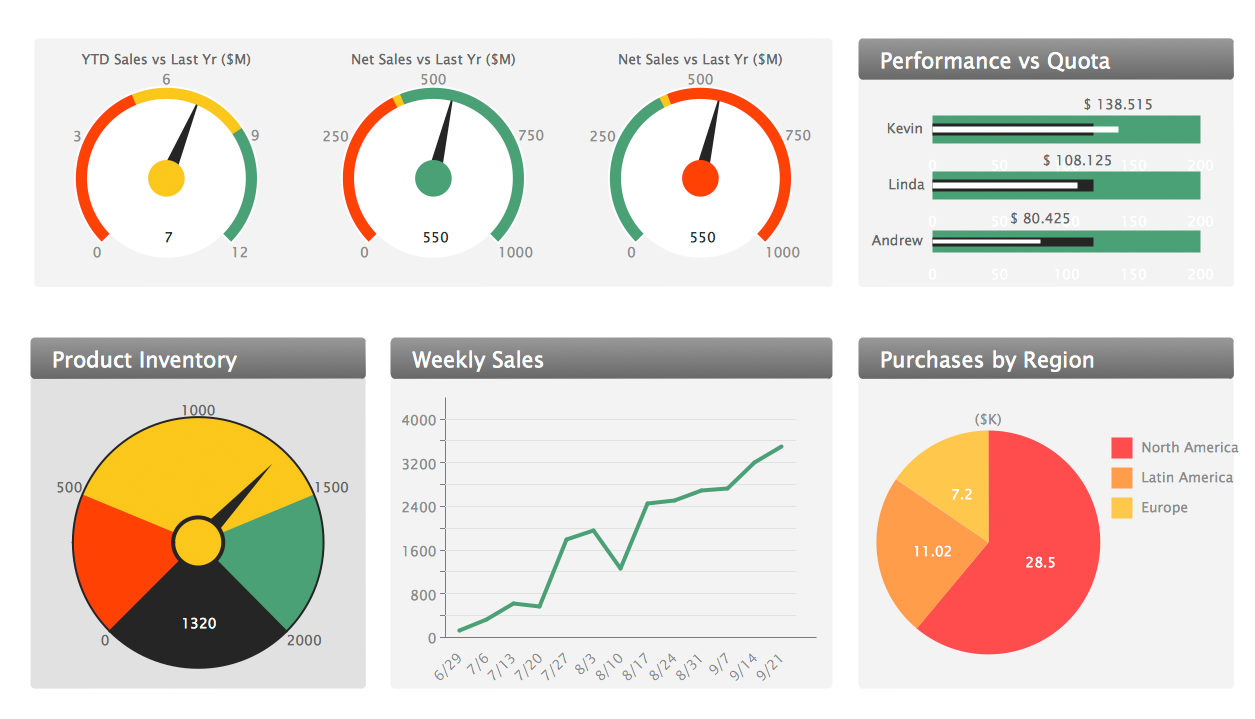
Example 1. Sales Dashboard
Sales Dashboard Solution offers 2 libraries of ready-to-use vector live objects, a set of data sources which can be connected to live objects, collection of predesigned samples and several basic templates for various types of Sales Dashboard.


These templates are handy for using. They are fully ready, you need only connect the live objects with data source files. The live objects refresh automatically the data from the file every 5 seconds, so you have always the actual information on your Sales Dashboard.

Example 2. Geographically Sales Dashboard
This Sales Dashboard was created in ConceptDraw DIAGRAM using the Sales Dashboard Solution and illustrates the distribution of the sales by geography. An experienced user spent 10 minutes creating this sample.
Use the Sales Dashboard Solution for ConceptDraw DIAGRAM software to create your own Sales Dashboard quick, easy and effective.
All source documents are vector graphic documents. They are available for reviewing, modifying, or converting to a variety of formats (PDF file, MS PowerPoint, MS Visio, and many other graphic formats) from the ConceptDraw STORE. The Sales Dashboard Solution is available for all ConceptDraw DIAGRAM or later users.


