Sales Dashboard Examples
Sales Dashboard Solution
The Sales Dashboard Solution gives users the ability to use live data to drive displays that show sales performance in a wide variety of graphs and allows users to use sales data to benchmark performance, predict long-term trends and set goals for their sales teams. The clean and dynamic dashboard samples with data-driven objects that are updates as the data changes.
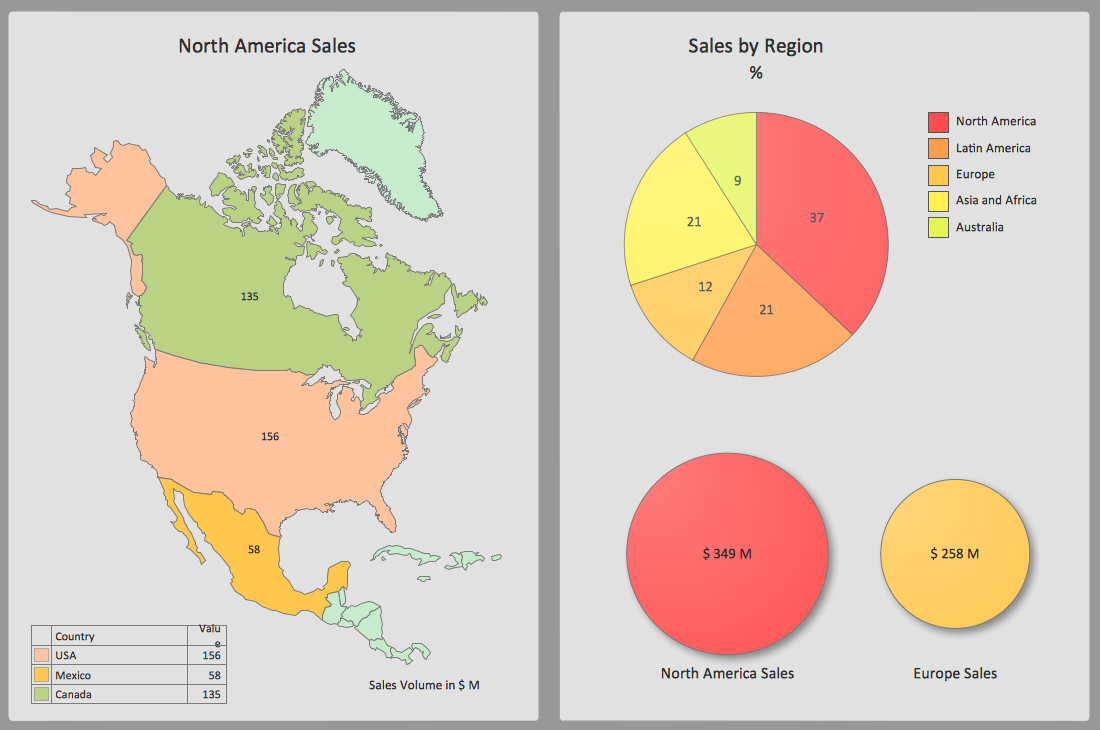
Pic. 1. Sales Geographically Dashboard
THREE RELATED HOW TO's:
Visualizing sales data help you see the facts and KPIs about your sales process to make conclusions and see how your business can improve.
Picture: The Facts and KPIs
ConceptDraw Sales Dashboard Solution is a simple and effective way of visualizing sales data and get clear picture of your sales process to see how your business can improve.
Picture: Sales Dashboard Solutionscan help your sales team keep an eye on performance
This sample was created in ConceptDraw DIAGRAM diagramming and vector drawing software using the UML Class Diagram library of the Rapid UML Solution from the Software Development area of ConceptDraw Solution Park.
This sample describes the use of the classes, the generalization associations between them, the multiplicity of associations and constraints. Provided UML diagram is one of the examples set that are part of Rapid UML solution.
Picture: UML Class Diagram Generalization ExampleUML Diagrams
Related Solution:
ConceptDraw
DIAGRAM 18