Management Consultant
A management consultant is an important person for the company, he helps in the questions of improving business performance and increasing profits, he consults for the questions of business strategy,management and financial controls, resources, and also suggests recommendations for changing the structure of the company if needed.
So, every day management consultant conduct the complex work and often use the helpful management infographics for explain his thoughts and arguments to the company direction. Thanks to the development of computer technologies, drawing of management infographics is so easy today. ConceptDraw DIAGRAM diagramming and vector drawing software offers you the Management Infographics Solution from the Business Infographics Area.
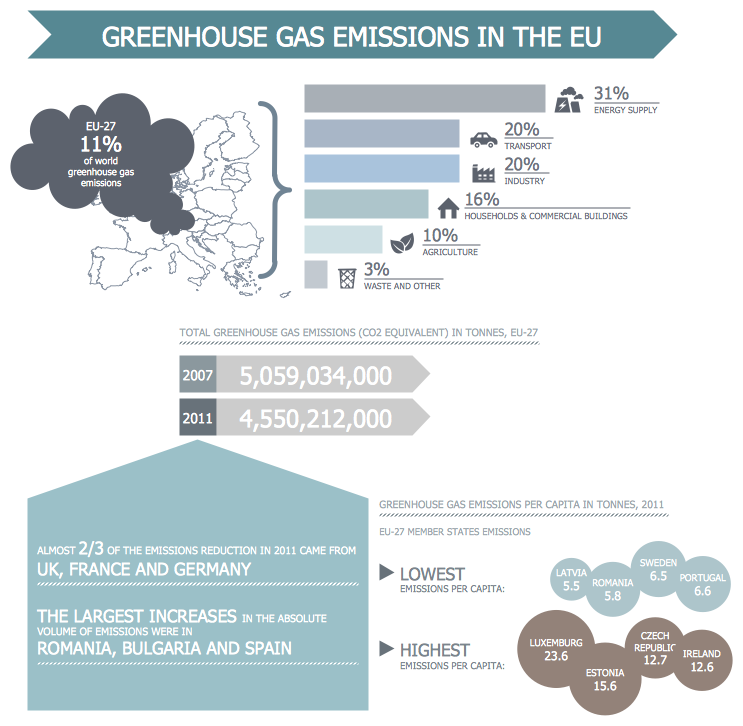
Example 1. EU Greenhouse Gas Emissions Management Infogram designed by management consultant in ConceptDraw DIAGRAM /p>
Now any management consultant don't need to be an artist to design professional looking and successful management infographics thanks to the collection of 14 libraries proposed by Management Infographics Solution.


To make an infographic of any complexity quick and easy the management consultant only need to choose the desired objects from the libraries, drag them to ConceptDraw document and arrange. Add also the text, use different fonts and colors to make your infographic exceptionally looking.

Example 2. Infrastructure Infogram - It's Time to Rebuild America
The samples you see on this page were created in ConceptDraw DIAGRAM using the vector objects from the Management Infographics Solution libraries. These examples successfully demonstrate solution's capabilities and the professional results you can achieve using it. The management consultant with any artistic abilities needs only 10-15 minutes to create the similar samples in ConceptDraw DIAGRAM
All source documents are vector graphic documents. They are available for reviewing, modifying, or converting to a variety of formats (PDF file, MS PowerPoint, MS Visio, and many other graphic formats) from the ConceptDraw STORE. The Management Infographics Solution is available for ConceptDraw DIAGRAM users.


