Data Visualization Solutions
Sales Dashboard Solution
ConceptDraw DIAGRAM is a powerful tool for making sales dashboards that provides performance to your company. The Sales Dashboard Solution gives users the ability to use live data to drive displays that show sales performance in a wide variety of graphs, meters and displays. The Sales Dashboard Solution allows users to use sales data to benchmark performance, predict long-term trends and set goals for their sales teams. The clean and dynamic dashboard objects are driven by data files, and are updated automatically as the data changes.

Pic. 1. Sales Dashboard Sample
TEN RELATED HOW TO's:
Pie Graph is very popular kind of charts which is widely used in various fields of science and life activities. ConceptDraw DIAGRAM extended with Pie Charts Solution from the Graphs and Charts area is the best software for drawing the Pie Graph Worksheets.
Picture: Pie Graph Worksheets
Related Solution:
Helps to create professionally looking and detailed Sales Flowcharts with all sales steps visually represented on them.
Use the Sales Flowcharts Solution for ConceptDraw DIAGRAM software to create your own Sales Flowcharts of any complexity quickly, easily and effectively to use them successfully in your work activity.
ConceptDraw DIAGRAM diagramming and vector drawing software supplied with unique Sales Flowcharts solution from the Marketing area of ConceptDraw Solution Park allows fast and easy visualize all sales steps of the sales process on a sales process Map or sales process flowchart, and then realize them easily.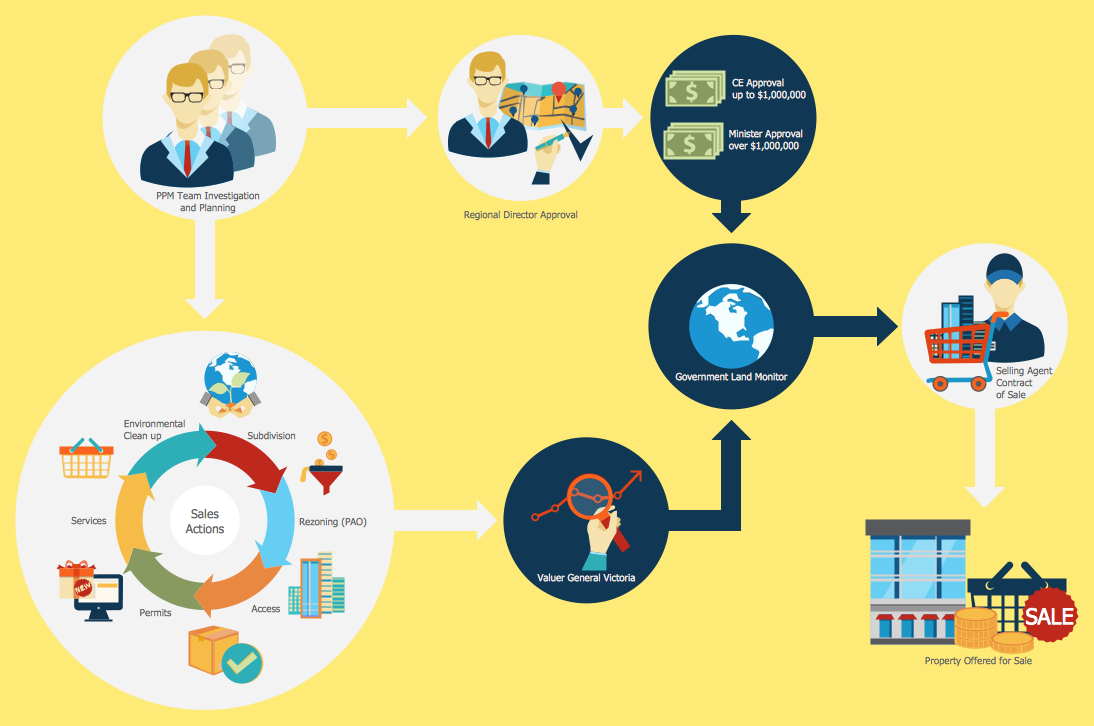
Picture: Sales Steps
Related Solution:
ConceptDraw DIAGRAM diagramming and vector drawing software offers the useful tools of the Sales Dashboard solution from the Marketing area for easy creating professional looking live dashboards which allow to track the business sales activity and progress thanks to representing the Key Performance Indicators (KPIs) on them.
Picture: Performance Indicators
Related Solution:
This sample shows the Pie Donut Chart. It was created in ConceptDraw DIAGRAM diagramming and vector drawing software using the ready-to-use object from the Pie Charts Solution from Graphs and Charts area of ConceptDraw Solution Park.
The Pie Donut Chart visualizes the percentage of parts of the whole and looks like as a ring divided into sectors. Pie Donut Charts are widely used in the business, statistics, analytics, mass media.
Picture: Pie Donut Chart. Pie Chart Examples
Related Solution:
To see how your business can improve you can try data visualization software solutions that allows you visualize all your sales KPI in one sales dashboard allows you monitor and analyse sales activities.
Picture: Data Visualization Software Solutions
A pie chart or a circle graph is a circular chart divided into sectors, illustrating numerical proportion. In a pie chart, the arc length of each sector and consequently its central angle and area, is proportional to the quantity it represents.
Pie chart examples and templates created using ConceptDraw DIAGRAM software helps you get closer with pie charts and find pie chart examples suite your needs.
Picture: Pie Chart Examples and Templates
Related Solution:
Developing Restaurant Layouts is very important and responsible moment in restaurant construction and designing. Now it's very simple and fast process thanks to the Cafe and Restaurant Floor Plans solution from the Building Plans area of ConceptDraw Solution Park.
Picture: Restaurant Layouts
Related Solution:
Using professional reporting and data visualization is the way your business can improve. ConceptDraw Sales Dashboard solution allows you produce live dashboards show KPI to monitor you sales activity and results in real time.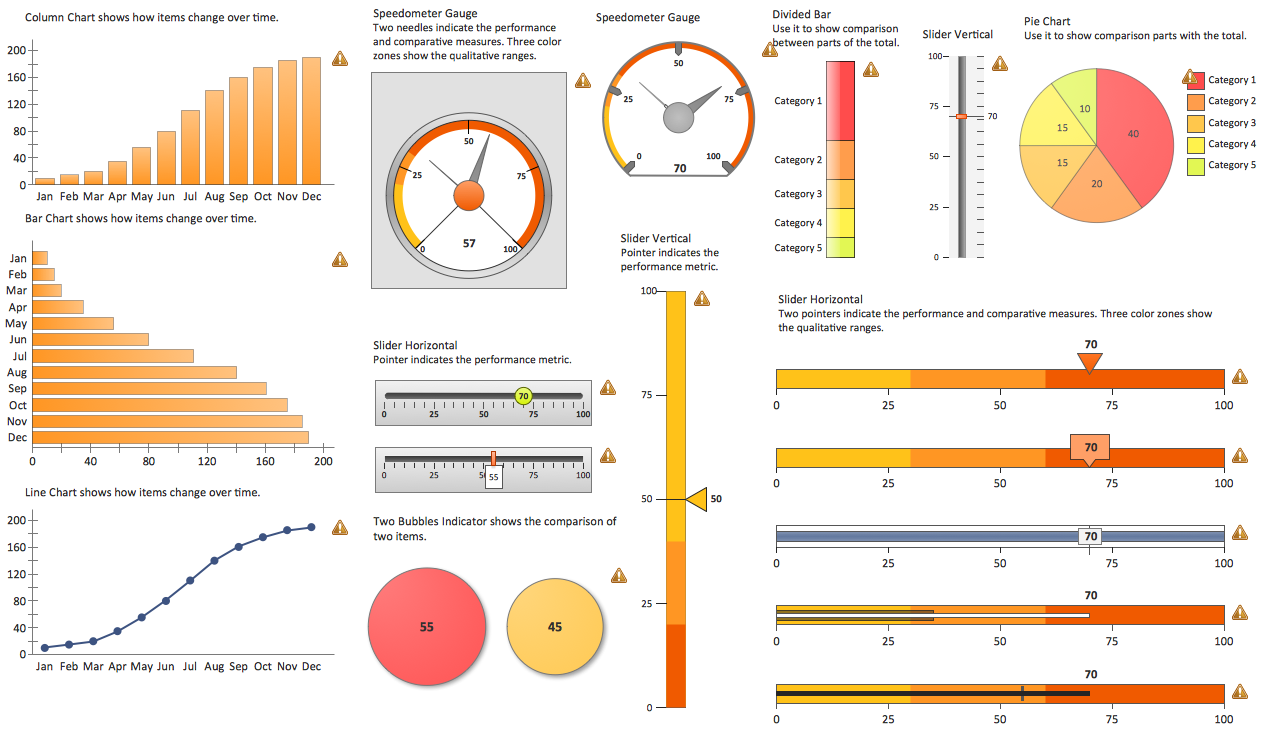
Picture: Reporting & Data Visualization
ConceptDraw DIAGRAM software extended with the Sales Dashboard solution delivers a complete set of samples, templates and pre-designed objects you need for visualizing sales data.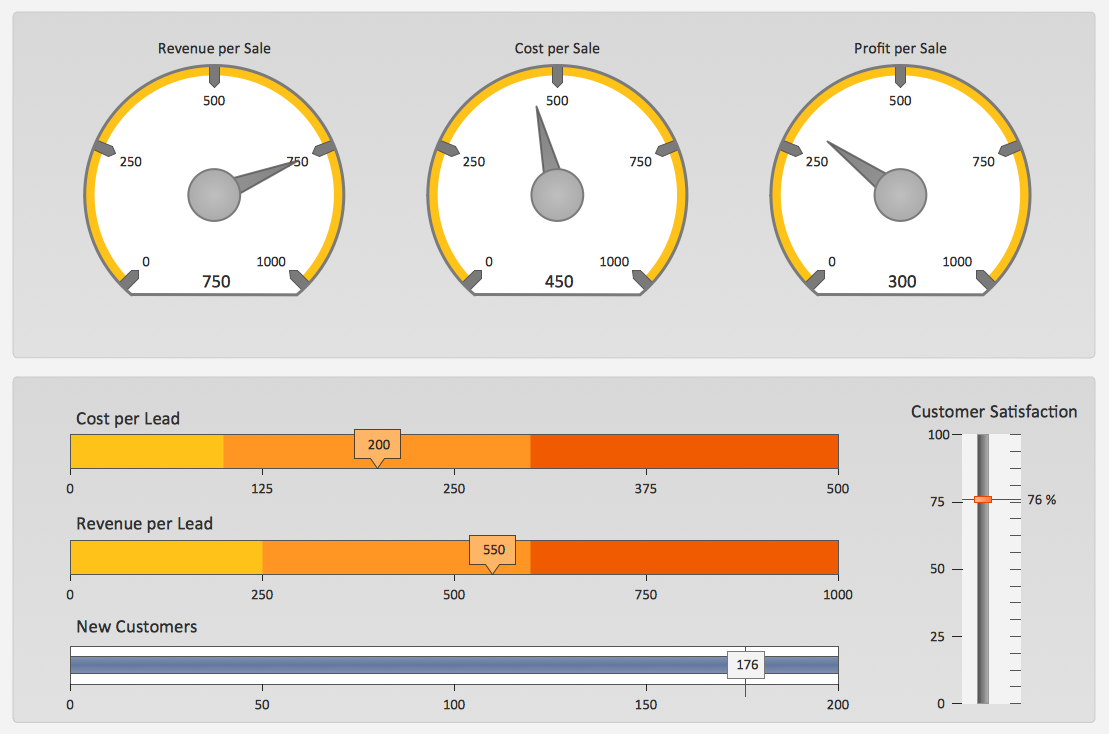
Picture: Sales Dashboard Template
ConceptDraw PROJECT is an effective tool for new and experienced users with a fine balance of usability and powerful functionality.
Picture: ConceptDraw PROJECT Software Overview
ConceptDraw
DIAGRAM 18