
Example 1. Percentage Pie Chart
Using the ready-to-use predesigned objects from the Pie Charts Solution for ConceptDraw DIAGRAM you can create your own professional looking Pie Charts quick and easy.
The Pie Charts produced with ConceptDraw DIAGRAM are vector graphic documents and are available for reviewing, modifying, and converting to a variety of formats (image, HTML, PDF file, MS PowerPoint Presentation, Adobe Flash or MS Visio).
Free Download Pie Chart Software and View All Examples and Templates
See also Samples:
TEN RELATED HOW TO's:
ConceptDraw DIAGRAM diagramming and vector drawing software offers the Marketing Diagrams Solution from the Marketing Area with extensive drawing tools, predesigned vector shapes, templates and samples for fast and easy drawing marketing charts and diagrams, marketing schemes and flow charts, various marketing illustrations, etc.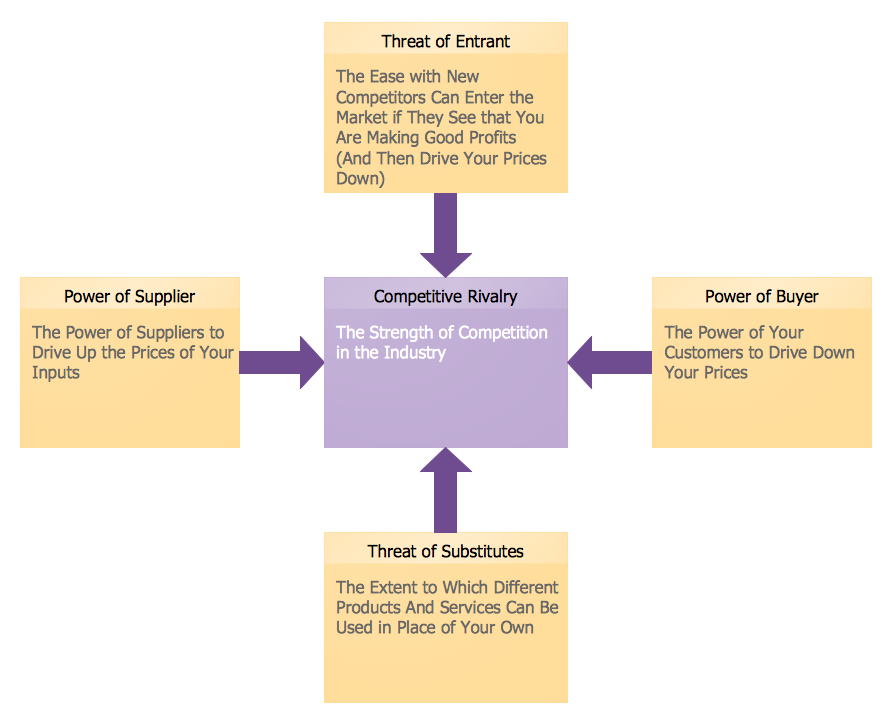
Picture: Marketing Charts
Related Solution:
UML Package Diagram illustrates the functionality of a software system.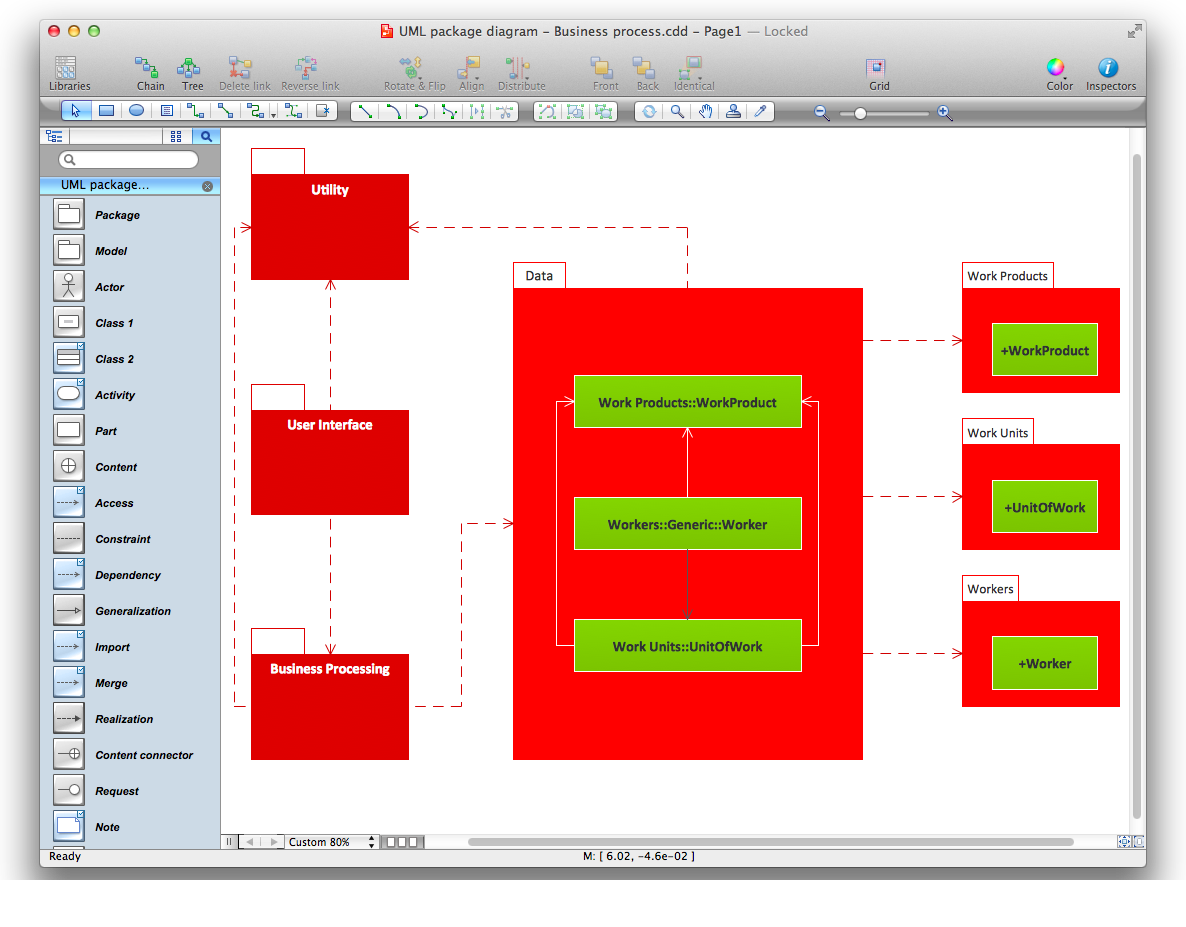
Picture: Diagramming Software for Design UML Package Diagrams
Mathematical Drawing Software - Draw mathematical illustration diagrams easily from examples and templates!
Picture: Basic Diagramming
Related Solution:
ConceptDraw DIAGRAM is the best BPMN software for ✔️ modeling business processes, ✔️ graphical documenting processes, ✔️ analysis processes, ✔️ optimization business processes, ✔️ identifying inefficiencies, ✔️ efficient decision-making based on created Business Process Diagrams and Business Process Models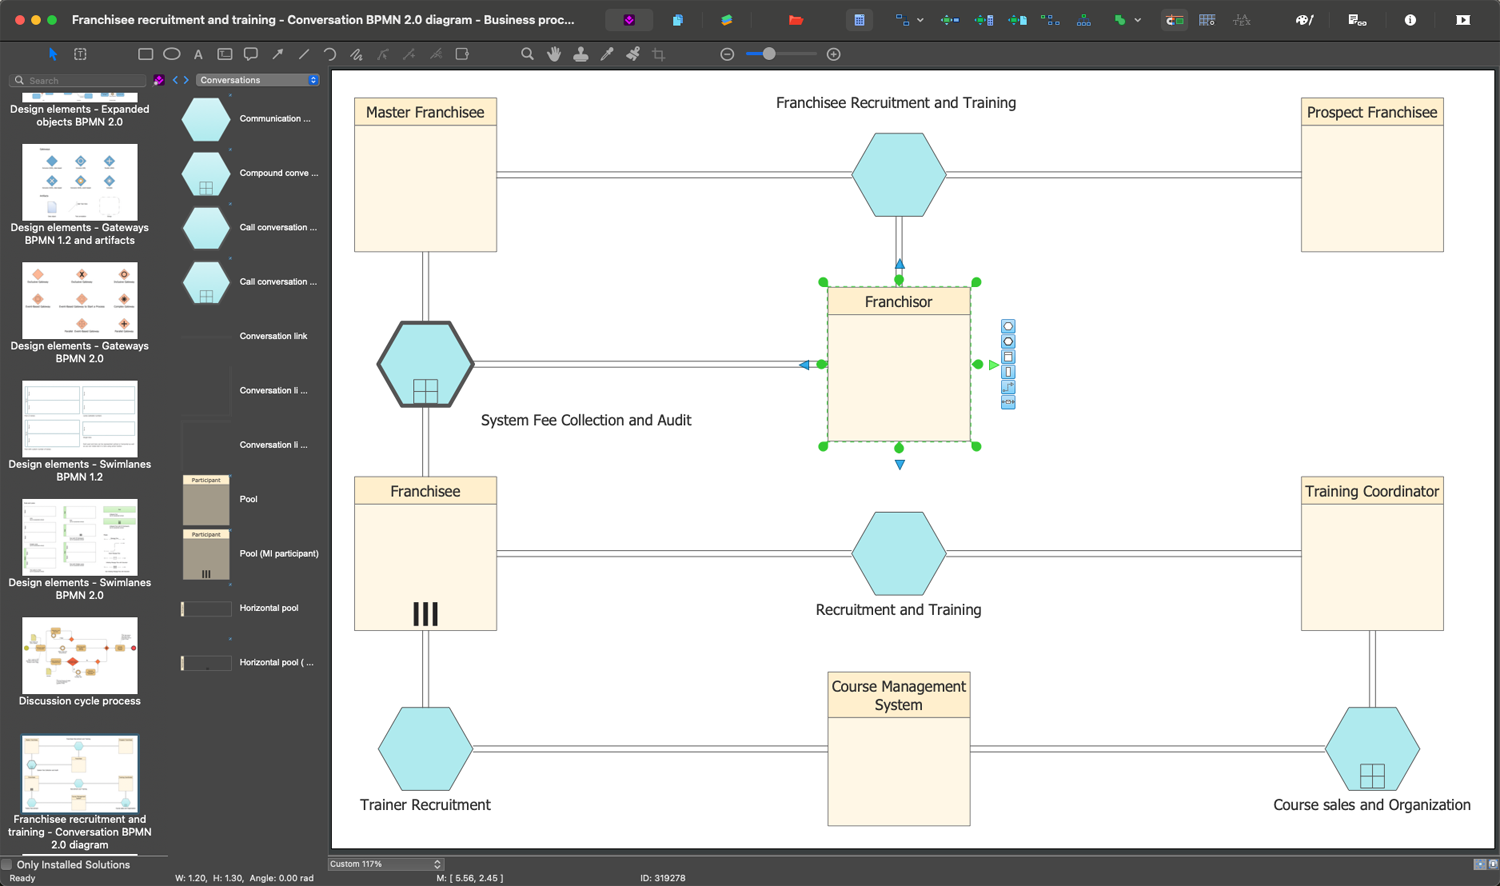
Picture: The Best Business Process Modeling Software: Comprehensive Guide
Related Solution:
The Cisco Network Diagrams solution from the Computer and Networks area of ConceptDraw Solution Park provides a wide collection of predesigned templates and samples that help you to create the Cisco Network Diagrams in one moment.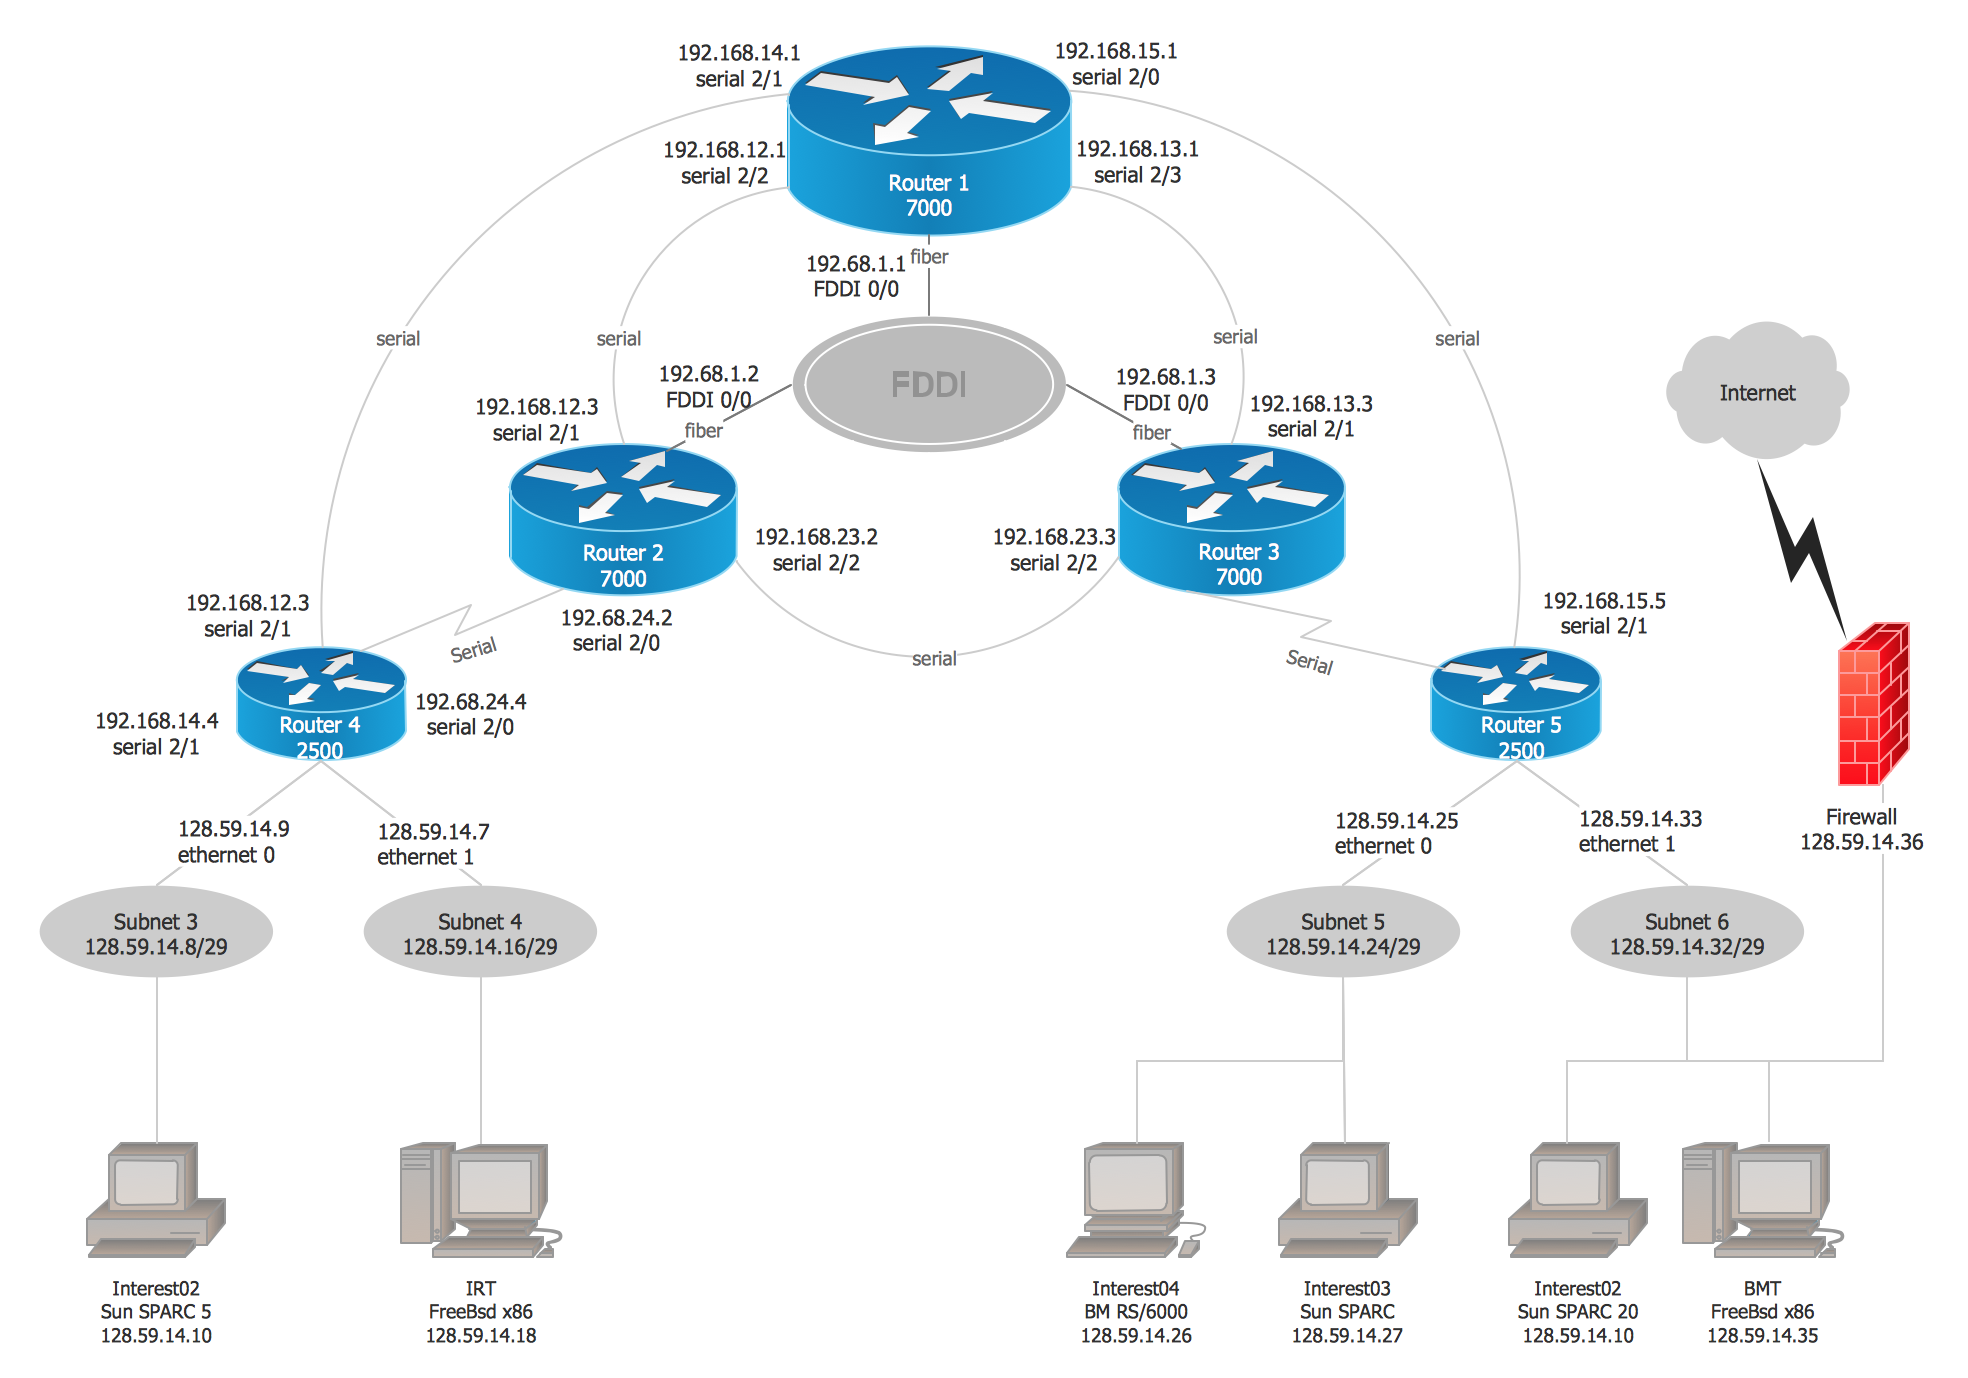
Picture: Cisco Network Examples and Templates
Related Solution:
ConceptDraw DIAGRAM is the best network diagram software. To design the Cisco Network Diagrams and visualize the computer networks topology use ConceptDraw DIAGRAM diagramming and vector drawing software extended with Cisco Network Diagrams solution for ConceptDraw DIAGRAM Solution Park.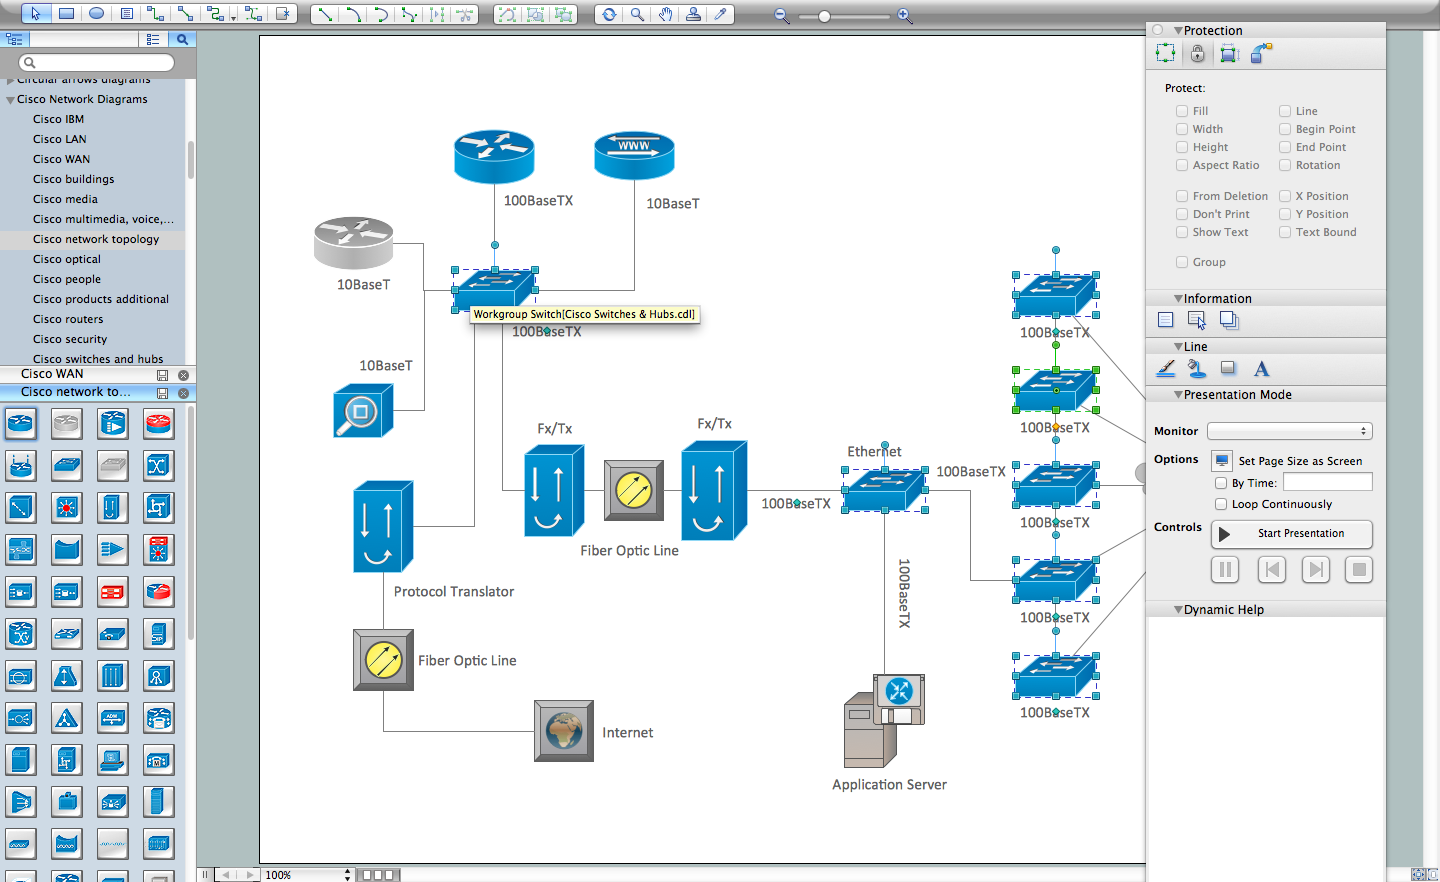
Picture: Cisco Network Diagram Software
Related Solution:
The vector stencils library from the solution Information Model Diagrams contains specific data type symbols of the EXPRESS-G notation such as entity data type symbols, simple data type symbols, enumeration data type symbols, defined data type symbols, select data type symbols and specific attribute symbols for ConceptDraw DIAGRAM diagramming and vector drawing software. The Information Model Diagrams solution is contained in the Software Development area of ConceptDraw Solution Park.
Picture: Express-G Diagram
If you are an advanced diagramming software user, you might use it daily. Traversing the Internet in searching of alternative to MS Visio for MAC and PC, you can fulfill all your requirements with ConceptDraw DIAGRAM. Don’t hesitate to transfer your documents to another operating system.
When looking for a smart and simple tool for business diagrams as alternative to MS Visio for Apple OS X platform, ConceptDraw DIAGRAM certainly is the best choice. Making many kinds of business charts, numerous technical drawings is what ConcepDraw DIAGRAM is the best. One can easy create any diagram and complete it perfectly and quickly. The big collection of vector object libraries, templates and samples, make it the best Microsoft Visio alternative: ConceptDraw DIAGRAM is simpler to use, less expensive, and supports project management and mind mapping methods.
Picture:
In Searching of Alternative to MS Visio for Mac and PC
with ConceptDraw DIAGRAM
ConceptDraw DIAGRAM extended with IDEF0 Diagrams solution from the Software Development area of ConceptDraw Solution Park is a powerful diagramming and vector drawing IDEF0 software. All IDEF0 diagrams created in ConceptDraw DIAGRAM are vector graphic documents and can be reviewed, modified and converted to MS Visio XML format. To obtain the IDEF0 Visio documents from ConceptDraw DIAGRAM documents use the wide export possibilities of ConceptDraw DIAGRAM.
Picture: IDEF0 Visio
Related Solution:
When you decide to represent data without spending lots of time you can effectively generate, change, and update your presentation to best meet your needs with ConceptDraw MINDMAP.
Picture: 3 Ways to Quickly Create Excellent Presentations
Related Solution: