
Pic. 1. Project Diagrams gallery.
The Gantt Chart diagram presents a basic view of your project. This can help during the early stages of discussion or when presenting to stakeholders.
PERT charts allow the tasks in a particular project to be analyzed, with attention paid to the time required to complete each task, and the minimum time required to finish the entire project.
The Resource Calendar gives you a two-page document for each resource. The first page is the Resource Usage diagram; the second page is a personal calendar detailing the resource's tasks.
The Timeline diagram gives you a timeline of all your projects and their level of completion on one page.
The Milestone Chart shows milestones with dates and relations contained on a timeline.
Radial Tasks Structure is an alternative way to visually analyze task structure level by level.
The Resource Usage diagram is a multipage document containing resource common loading information and detailed loading for each resource.
The Work Breakdown Structure shows the deconstruction of a project into smaller components.
Transforming project data into different visual forms is a productive way of looking at your project from different perspectives. It also helps you deliver project information in suitable way depending on your objectives and audience.
NINE RELATED HOW TO's:
It's impossible to imagine our life without infographics! They are very popular in many fields of science, work and life activity. Management infographics, daily infographic are the good way for representing various information, complex knowledge in a visual comprehensive form. Try design them quick, easy and effective with new powerful Management Infographics Solution from the Business Infographics Area for ConceptDraw Solution Park.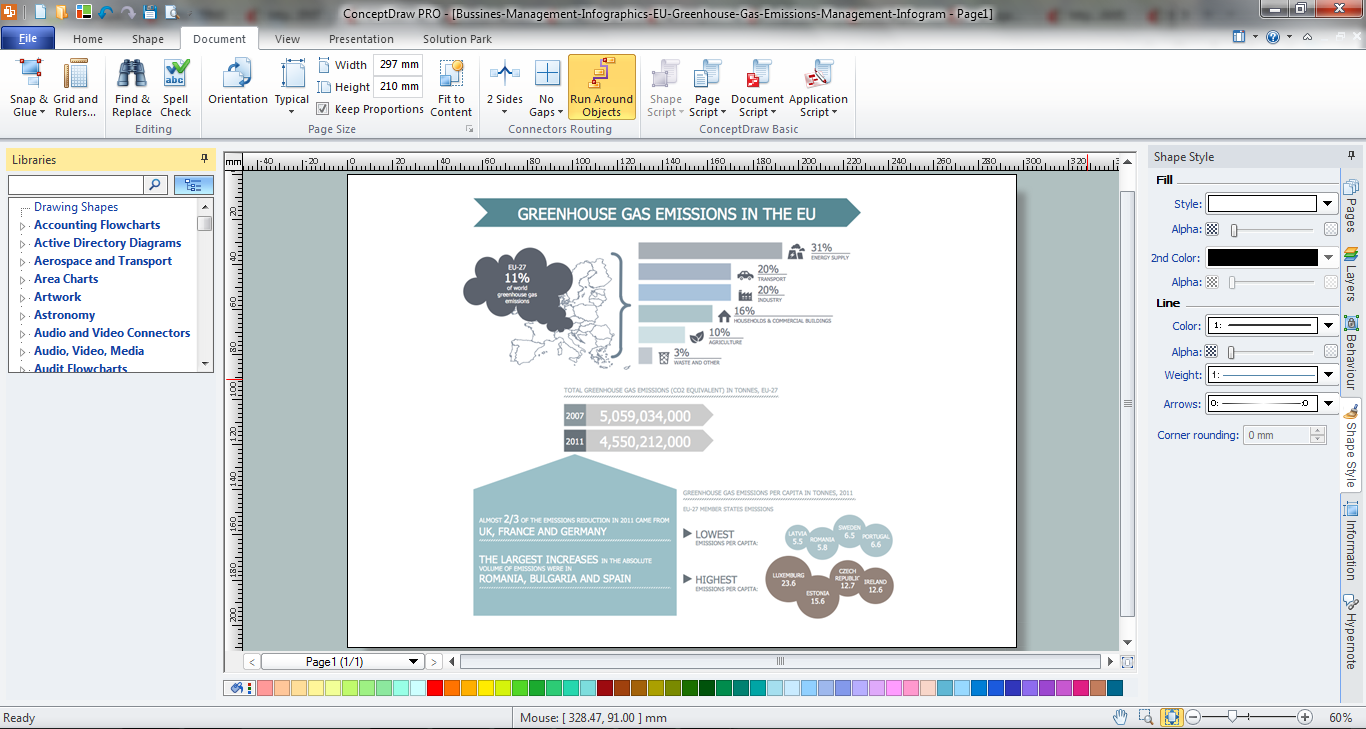
Picture: Daily Infographic
Related Solution:
When designing a network, it is important to take into account the hierarchy of network devices. When you have a root device you should consider a tree network topology that might have any number of lower levels as you might need. This technology is based on star and bus network topologies.
This is a schematic representation of a Tree computer network topology. A tree topology means that some star networks are linked together. A star network is a topology of the local network where a central workstation is connected with each end-user computer or peripherals. A tree structure means that, the central nodes of these star networks are linked to a main cable (the Bus topology). So, a Tree network topology is a few Star networks connected into a Bus topology. This scheme can be applied to draw the particular physical or logical network diagrams using the ConceptDraw Computer and Networks solution.
Picture: Tree Network Topology Diagram
Related Solution:
UML Diagrams Social Networking Sites Project. This sample was created in ConceptDraw DIAGRAM diagramming and vector drawing software using the UML Use Case Diagram library of the Rapid UML Solution from the Software Development area of ConceptDraw Solution Park.
This sample shows the Facebook Socio-health system and is used at the projection and creating of the social networking sites.
Picture: UML Use Case Diagram Example. Social Networking Sites Project
Related Solution:
The PERT Chart is constructed as part of the process in creating a schedule of corrective actions. The PERT Chart shows the logical connections and consequence of tasks to be performed. It displays the time period for problem solving and the implementation of all activities through the critical path.
ConceptDraw Office suite is a software for corrective actions planning.
Picture: CORRECTIVE ACTIONS PLANNING. PERT Chart
The strategic balance is a combination of factors that can both positively and negatively affect the activity of the company. To know the factors that influence the organization success, managers should use SWOT matrix template that will define the potential inner strengths and weaknesses and potential external opportunities and threats. This matrix does not contain a ready solution, but allows to streamline all the available information.
This is a handy template of a SWOT matrix. It can serves as a visual guide for management students. To simplify the task, on the left and on the right we have added hints with examples of external and internal factors. This template one can found among numerous templates of SWOT and TOWS matrices that are included in the the eponymous solution by ConceptDraw Solution Park.
Picture: SWOT Matrix Template
ConceptDraw DIAGRAM is the professional business graphic software for drawing diagrams and charts with great visual appeal on Mac OS X.
Picture: The Best Drawing Program for Mac
Related Solution:
ConceptDraw DIAGRAM is a Mac OS X and Windows platforms professional software to draw your own business process diagrams and flowcharts.
Picture: Professional Diagram and Flowchart Software
A flowchart is a widely used type of diagram that visually represents an algorithm, workflow or process, using the boxes of various kinds to depict the steps and connecting them with arrows to show the order of execution these steps. Еhe ConceptDraw DIAGRAM supplied with Accounting Flowcharts Solution from the Finance and Accounting Area of ConceptDraw Solution Park is a powerful diagramming and vector drawing software which ideally suits for designing Ordering Process Flowchart of any complexity.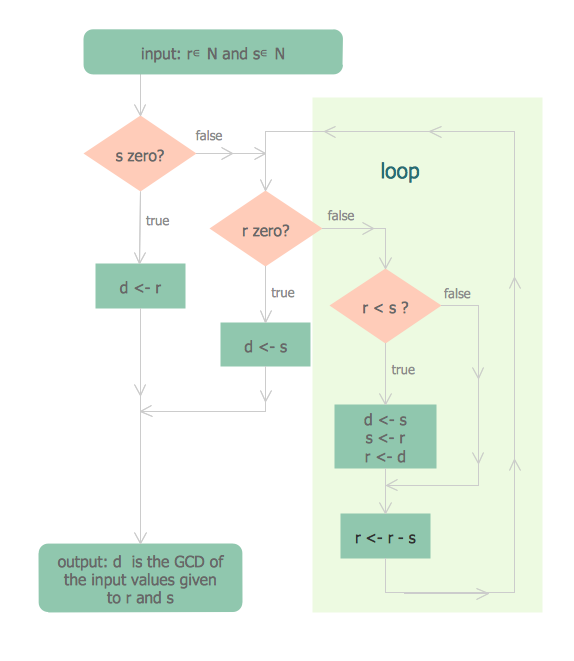
Picture: Ordering Process Flowchart. Flowchart Examples
Related Solution:
Astronomy and astrology require from the specialists permanent drawing wide variety of illustrations, sketches. It’s convenient for astronomers and astrologers to have software that will help design them quick and easy. ConceptDraw DIAGRAM diagramming and vector drawing software extended with Astronomy solution from the Science and Education area is exactly what they need.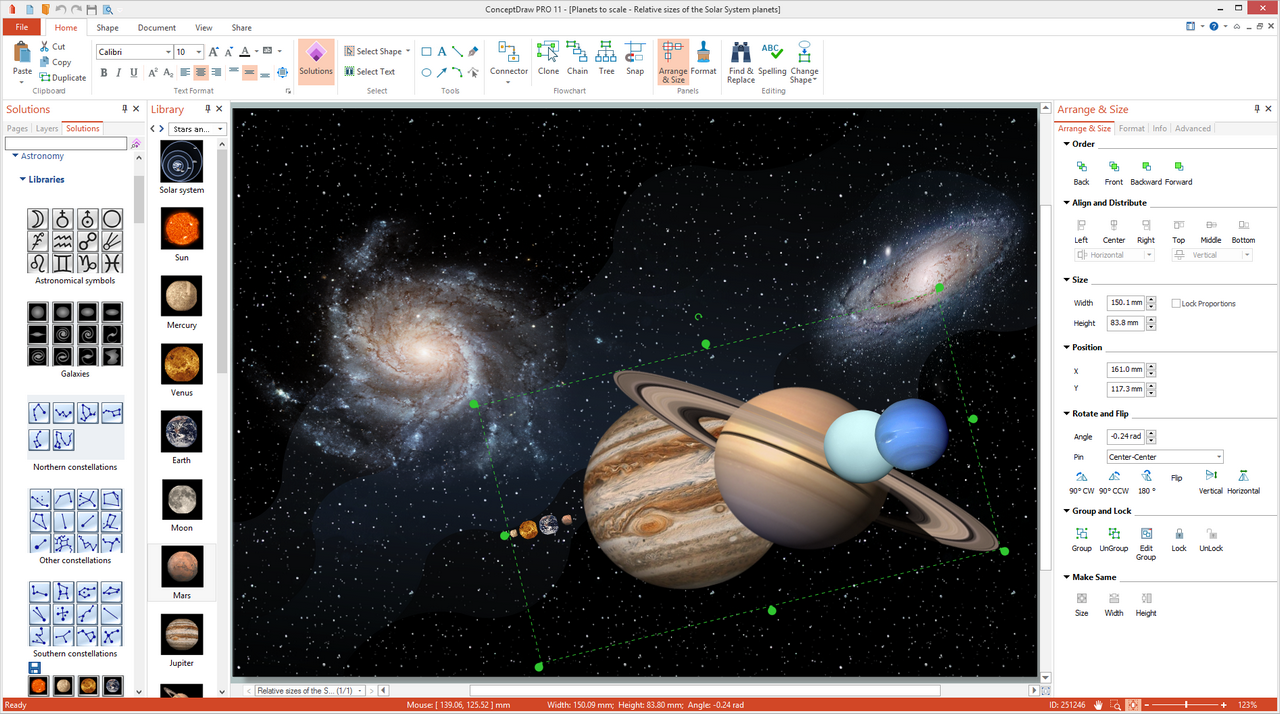
Picture: Astronomy and Astrology
Related Solution:


