Sample 1. ConceptDraw PROJECT Gantt Chart Software
ConceptDraw STORE offers you the Project Exchange Solution from the Collaboration Area that allows to get instantly the access to the ConceptDraw PROJECT

Sample 2. Project Exchange Solution in ConceptDraw STORE
Use the New Project Template from the Project Exchange Solution from ConceptDraw STORE to quickly create the new project in ConceptDraw PROJECT Easily create and organize the tasks, assign resources, track and manage any activity or event that requires planning, budgeting or tracking a variety of resources, with ConceptDraw PROJECT !

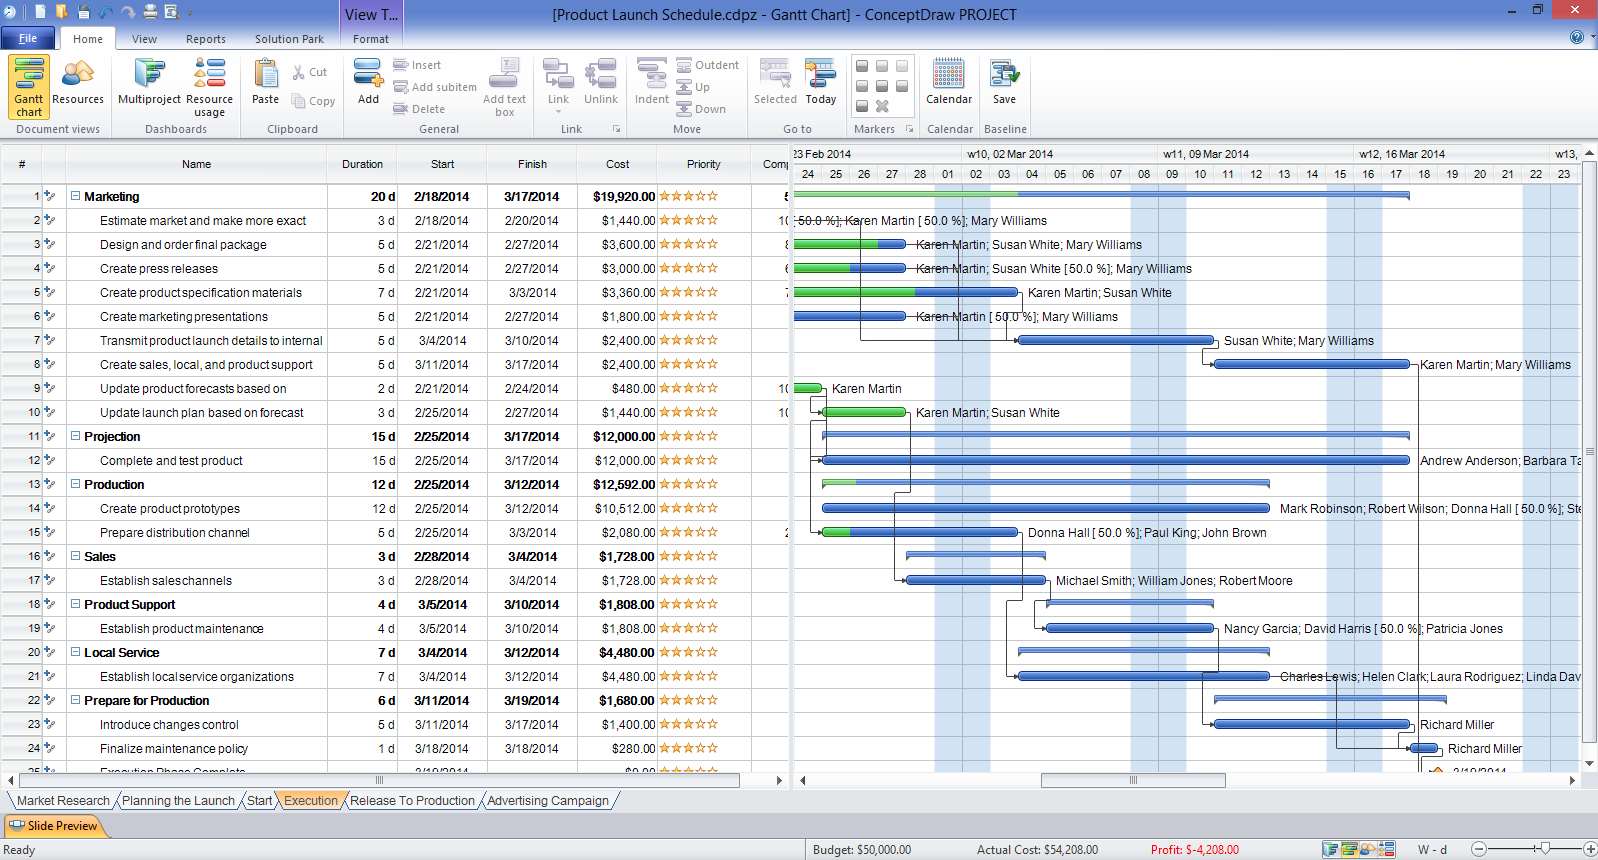
Sample 3. Gantt Chart Sample
Use ConceptDraw PROJECT and Project Exchange Solution from the Collaboration Area from ConceptDraw STORE to create and manage your single and multiple projects quick, easy and effectively.
The Benefits for ConceptDraw PROJECT Gantt Chart Software
- ConceptDraw PROJECT is an effective tool with powerful functionality which is ideal for planning, scheduling and monitoring project development, allocation of budget and resources.
- ConceptDraw PROJECT enables you to manage single and multi-projects, create visual project dashboards and diagrams, generate various kinds of reports with one click.
- ConceptDraw PROJECT provides wide capabilities of importing and exporting in various formats: Microsoft Project, ConceptDraw MINDMAP, Mindjet MindManager, PDF file.
TEN RELATED HOW TO's:
This sample was created in ConceptDraw DIAGRAM diagramming and vector drawing software using the Organizational Charts Solution from the Management area of ConceptDraw Solution Park.
The Organizational Chart is a diagram that shows the structure of the organization, different levels of management, hierarchy and the relationships of the organization parts.
Picture: Horizontal Org Flow Chart
Related Solutions:
There are many tools to manage a process or to illustrate an algorithm or a workflow. Flowcharting is one of those tools. However, it may be difficult to show complex processes that require multiple attributes or several people in a simple flowchart, so a cross-functional flowchart would be a solution for that situation. To create such flowchart, group processes and steps to labeled rows or columns, and divide those groups with horizontal or vertical parallel lines. It is worth mentioning that there are different types of cross-functional flowcharts, like opportunity or deployment flowchart.
This diagram shows a cross-functional flowchart that was made for a trading process. It contains 14 processes, distributed through 5 lines depicting the participants who interact with the process. Also there are connectors that show the data flow of information between processes. The cross-functional flowchart displays a detailed model of the trading process, as well as all participants in the process and how they interact with each other. The lines in the flowchart indicates the position, department and role of the trading process participants.
Picture: Cross-Functional Flowchart
Related Solution:
While designing a conceptual data model, you should use appropriate software. For instance, ConceptDraw DIAGRAM is a user-friendly ER diagram tool that has a lot of samples and templates to facilitate your work. A clear entity-relationship diagram helps to define the relations between system’s components.
Software engineering is the section of a computer science engaged to design, realization, and support of complex software products. An ERD is a data modeling method that is widely applied in the software engineering practice. Commonly it is used for developing a structure of a a relational database. An entity relationship diagram is helpful for structuring and organizing databases that can be modeled using a relational structure. An entity relationship diagram is designed to depicts the interrelationships within the sets of entities which are accumulated in the database. Each entity represents a particular component of a data. Thus, ER diagrams depicts the logical structure of databases. ConceptDraw ER Diagrams solution provides software engineers with the professional tool for making entity-relationship diagrams.
Picture: Entity Relationship Diagram Software Engineering
Related Solution:
Use Software Diagram Templates from the solutions of Software Development area for ConceptDraw DIAGRAM to create your own professional looking Software Diagrams in minutes.
The Software Diagrams designed with ConceptDraw DIAGRAM are vector graphic documents and are available for reviewing, modifying, converting to a variety of formats (image, HTML, PDF file, MS PowerPoint Presentation, Adobe Flash or MS Visio XML), printing and send via e-mail in one moment.
Picture: Software Diagram Templates
Diagrams are a very important part of modern life. With the help of flow diagram software, a lot of companies can promote their ideas at the market. Its usefulness is totally doubtless.
This is a flow chart of the invoice payment flow. This flowchart details decrypts all stages of the process of obtaining and paying bills. It is a description of the universal process - such steps performs accounting departments of almost any organization. Since every business no matter what it does is a consumer of some goods or services. The given flow chart was made using ConceptDraw DIAGRAM software and the Diagrams solution for making flowcharts of any kind.
Picture: Flow Diagram Software
Related Solution:
Users new to ConceptDraw PROJECT will find the Basic lessons an essential platform for familiarizing themselves with the program′s functions. Learn how to assign resources to tasks in ConceptDraw PROJECT with this comprehensive video lesson.
Picture: Project — Assigning Resources
Related Solutions:
ConceptDraw DIAGRAM extended with Seven Management and Planning Tools Solution from the Management Area of ConceptDraw Solution Park is the best software for drawing all types of diagrams from the Seven Management and Planning Tools: Affinity Diagram, Relations Diagram, Prioritization Matrix, Root Cause Analysis Tree Diagram, Involvement Matrix, PERT Chart, and Risk Diagram (PDPC).
Picture: PDPC
Related Solution:
Data modeling is actively applied in analysis and uses wide set of methods for description the data requirements in a system. One of the most popular and well-known is the ERD method of database modeling.
The best ERD tool for the Mac and Windows is ConceptDraw DIAGRAM software extended with the Entity-Relationship Diagram (ERD) solution from the Software Development Area for ConceptDraw Solution Park, which is sharpened for professional ERD drawing and data modeling with Entity Relationship Diagram.
Picture: Data Modeling with Entity Relationship Diagram
Related Solution:
This sample shows the Purchasing Flow Chart Diagram that displays the money flow in the carbon offset sphere. The carbon offsets are the compensatory measures that the companies make for the carbon emissions. You can see on this sample the groups that have interests in the carbon offsets and the money flow after the carbon offset vendors sold the carbon offsets.
Picture: Purchasing Flow Chart.Purchasing Flowchart Example
Related Solution:
You can design the Prioritization Matrix by hand on the paper, but we offer you the most easier way — to use the ConceptDraw DIAGRAM diagramming and vector drawing software extended with Seven Management and Planning Tools Solution from the Management Area.
Picture: Prioritization Matrix
Related Solution:
