Sales Dashboards for Your Company
Sales Dashboard Solution
The Sales Dashboard Solution gives managers the ability to use live data to drive displays that show company performance in a wide variety of graphs. ConceptDraw DIAGRAM is a software for making Live graphic data that provide effectiveness to your business. By using dashboards owners or stockholders can obtain benefits:
- Visually performance presenting
- Generating detailed reports
- Gain total visibility of all systems instantly

Pic. 1. Sales Dashboards
TEN RELATED HOW TO's:
ConceptDraw DIAGRAM software extended with the Sales Dashboard solution allows you visualize sales data using sample data delivered with the solution to choose visual indicators you need, and then connect these indicators to your real data.
Picture: Visualize Sales Data Using Sample Data
This sample was created in ConceptDraw DIAGRAM diagramming and vector drawing software using the Pie Charts Solution from Graphs and Charts area of ConceptDraw Solution Park.
This sample shows the Pie Chart of the approximate air composition. You can see the percentage of oxygen, nitrogen and other gases in the air visualized on this Pie Chart.
Picture: Percentage Pie Chart. Pie Chart Examples
Related Solution:
ConceptDraw PROJECT contains an extensive tool set to help project managers. The rich data visualization capability that is provided by ConceptDraw products helps you create project dashboards, one-click reports, multi-project views, Gantt charts, and resource views. Let′s learn how to get maximum value using ConceptDraw PROJECT!
Picture: How To Create Project Report
In Cross-Functional Flowchart first step is to determine how many lanes you want to represent and what the lane titles will be. The choice of vertical or horizontal swim lanes landscape comes down to personal choice or just plain “what fits best”.
With ConceptDraw, we make that simple by including different swim lanes templates.
Professional looking examples and templates of Swimlane Flowchart which help you create Cross Functional Flowcharts rapidly.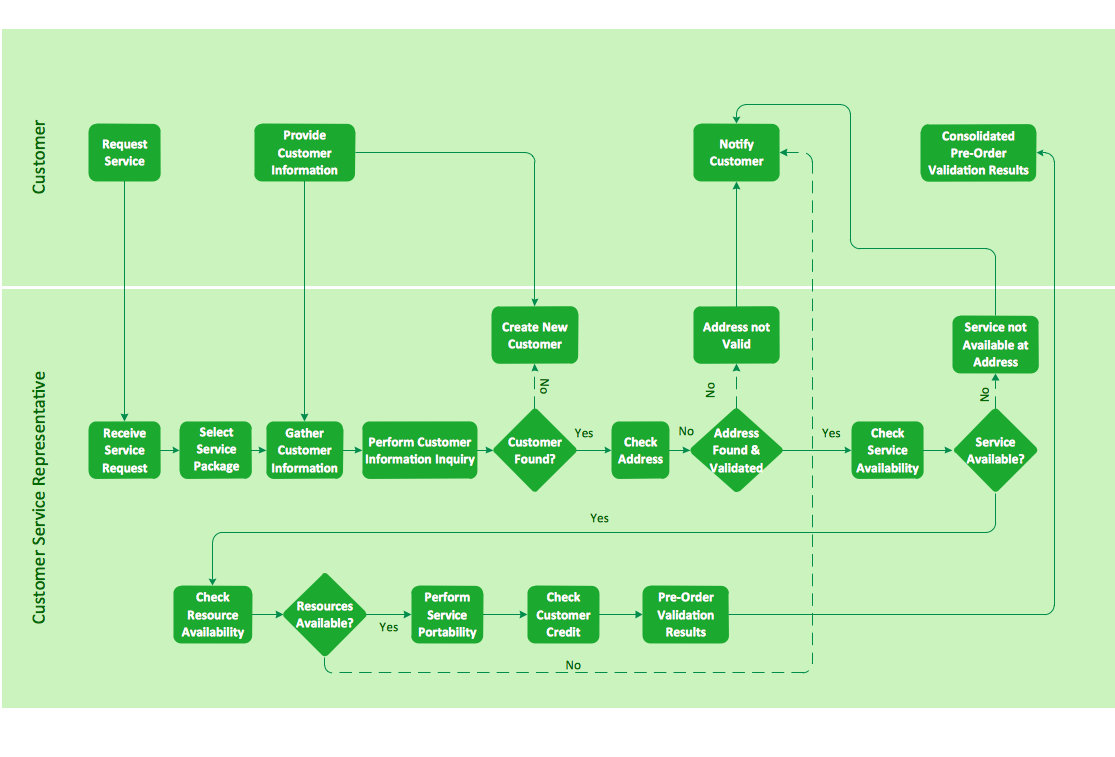
Picture: Cross-functional flowchart landscape, U.S. units
The Total Quality Management Diagram solution helps you and your organization visualize business and industrial processes. Create Total Quality Management diagrams for business process with ConceptDraw software.
Picture: TQM Diagram Example
Related Solution:
ConceptDraw MINDMAP - an excellent tool for exporting mind maps to PowerPoint to visualize and presenting your project. You can simply generate, change, update your mindmap and then make a presentation in PowerPoint.
Picture: How To Do A Mind Map In PowerPoint
Related Solution:
ConceptDraw DIAGRAM diagramming and vector drawing software supplied with Sales Dashboard solution provides the full set of useful tools which make it the best for producing the live KPI Dashboard of any complexity.
Picture: KPI Dashboard
Related Solution:
ConceptDraw Sales Dashboard gives you a clear insight about potential opportunities and key sales operations. Analysing sales KPI is a proven way to see how your business can improve.
Picture: Sales Dashboard - insight about potential opportunities and key sales operations
Bar charts represent data in different categories or groups.
Create bar graphs for visual solving your scientific problems and data comparison using the ConceptDraw DIAGRAM diagramming and vector drawing software extended with the Bar Graphs Solution from the Graphs and Charts area of ConceptDraw Solition Park.
Picture: Bar Diagrams for Problem Solving.Create space science bar charts with Bar Graphs Solution
Related Solution:
When we think of an hierarchy, we intuitively imagine a pyramid. Thus, a lot of management tools use pyramid charts as examples or illustrations of various documents or models. You can create any type of triangle diagram using ConceptDraw DIAGRAM.
A triangle (pyramid) diagram is often used in marketing to show the data hierarchy. This pyramid diagram represents the Top Brand Model. It illustrate the model of rebranding strategy. It can be used by marketing agency dealing with rebranding strategies development. It’s critical for marketing diagrams to be both clear and eye catching. ConceptDraw Pyramid diagrams solution meet all these requirements and can be successfully applied for creating and presenting various marketing pyramidal diagrams.
Picture: Pyramid Chart Examples
Related Solutions:
ConceptDraw
DIAGRAM 18