Ways You Can Visualize Sales Data
Sales Dashboard Solution
ConceptDraw DIAGRAM is a powerful tool for making sales data dashboards that provides KPI's of your company. The Sales Dashboard Solution allows managers to use live data to drive displays that show sales performance in a wide variety of graphs, meters and charts. The Sales Dashboard Solution also allows users to use sales data to benchmark performance, predict long-term trends and set goals for their sales teams. The clean and dynamic dashboard objects are driven by data files, and are updated automatically as the data changes.
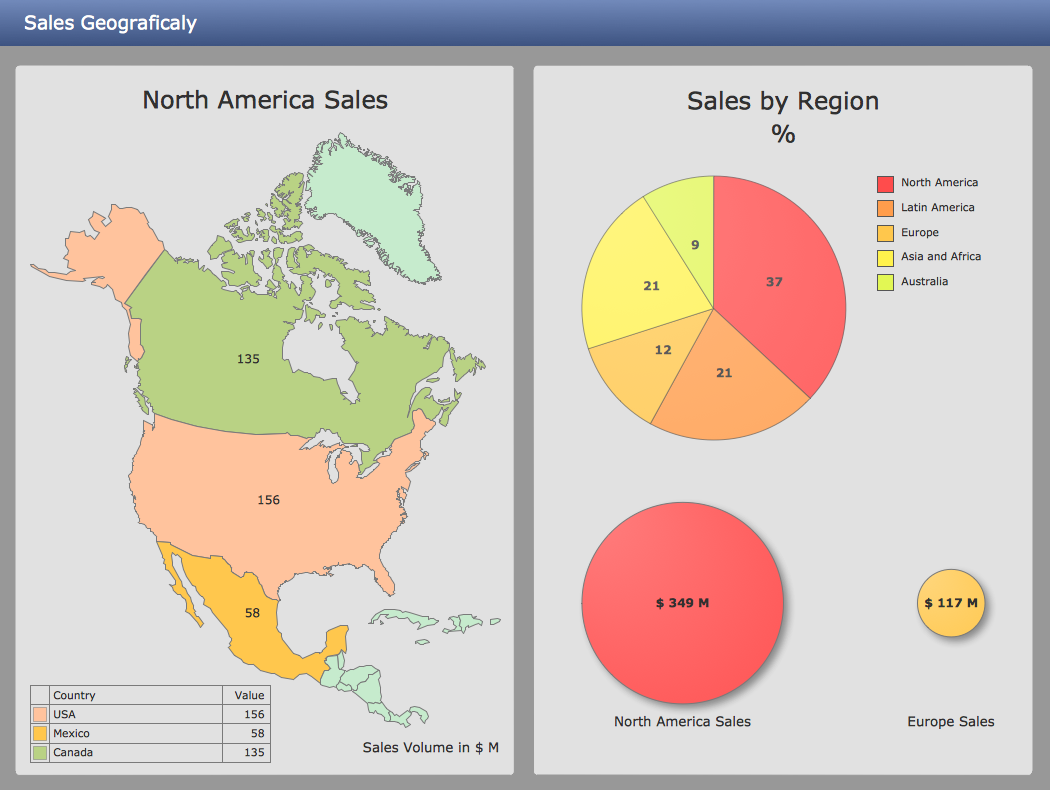
Pic. 1. Sales KPIs Dashboard Sample
THREE RELATED HOW TO's:
Visualizing sales data help you see the facts and KPIs about your sales process to make conclusions and see how your business can improve.
Picture: The Facts and KPIs
The choice of KPIs and metrics you use is key point of success when measuring sales process. Visualizing sales data using ConceptDraw Sales Dashboard solution for ConceptDraw DIAGRAM gives you a choice from numerous pre-designed indicators for different metrics you may need.
Picture: KPIs and Metrics
There are available tool to lend a fresh look to quality procedures - ConceptDraw MINDMAP.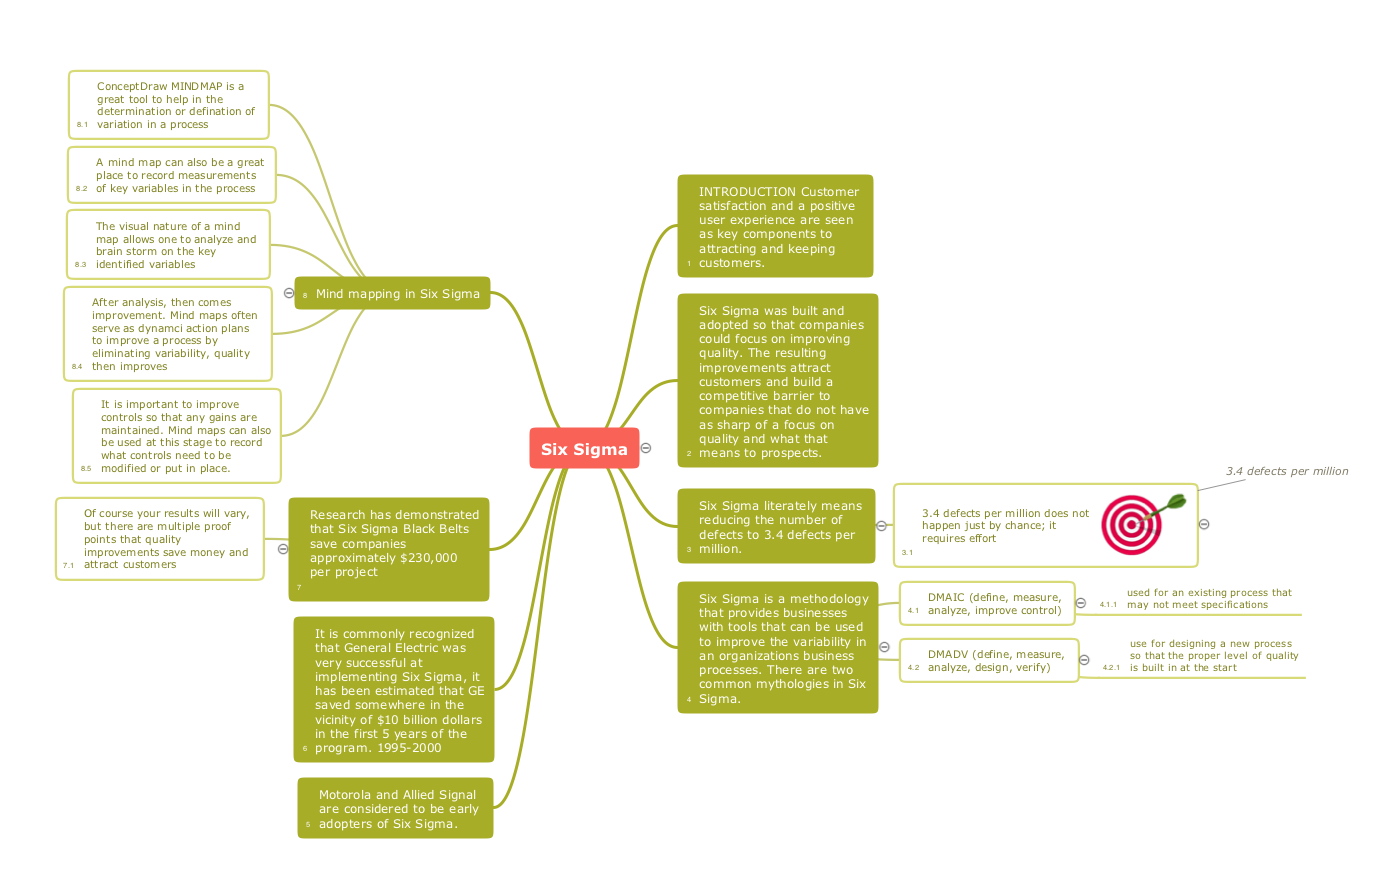
Picture: Constant improvement of key performance indicators
Related Solution:
ConceptDraw
DIAGRAM 18