
Sample 1. SWOT analysis mindmap template.
The SWOT Analysis solution from ConceptDraw Solution Park contains easy-to-use mind map templates that help identify Strengths, Weaknesses, Opportunities, and Threats using ConceptDraw MINDMAP, as well as outputs to ConceptDraw DIAGRAM for presenting SWOT and TOWS analysis results.
You can use ConceptDraw MINDMAP and ConceptDraw DIAGRAM software both on Macintosh and Windows computers.
See also:
Marketing — Matrices
- Marketing positioning matrix - Product positioning map
- Product-market matrix - Ansoff matrix
- BCG matrix - Boston growth-share matrix
- Feature comparison chart - Digital scouting cameras
- Marketing matrix diagram - Competitive strategies
- Marketing matrix diagram - Porters value chain
Marketing — Mind Maps
- Marketing mindmap - Marketing research project
- Marketing mind map - Strategic accomplishment mapping
- Twitter Compaign for New Software Product
- Marketing mind map - Sales Call
TEN RELATED HOW TO's:
ConceptDraw DIAGRAM diagramming and vector drawing software offers the School and Training Plans Solution from the Building Plans Area with extensive drawing tools, predesigned vector shapes and samples which are convenient for using as is or as classroom seating chart template.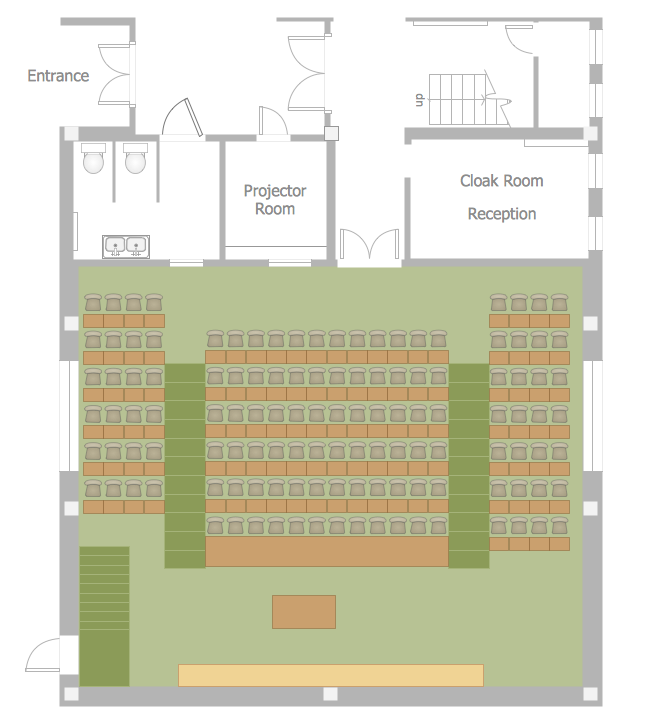
Picture: Classroom Seating Chart Template
Related Solution:
ConceptDraw DIAGRAM is a Mac OS X and Windows software. Numerous vector stencils, samples and templates created by designers are included in the basic package. This is classic flowchart maker which exactly follows the industry standards using flowchart symbols geathered during a ten years into solution park.
Picture: Flowchart Software
Related Solution:
The Internet is a huge world with unlimited possibilities. But with all its numerous advantages, the Internet also conceals many dangers and security threats, that's why we advise you to follow simple network security tips. ConceptDraw DIAGRAM diagramming and vector drawing software supplied with Network Security Diagrams Solution from the Computer and Networks Area of ConceptDraw Solution Park is an ideal software for easy designing Network Security Diagrams and attractive illustrations with effective network security tips.
Picture: Network Security Tips
Related Solution:
This sample shows the Perceptual map. It was created in ConceptDraw DIAGRAM diagramming and vector drawing software using the Matrices Solution from the Marketing area of ConceptDraw Solution Park.
Perception Mapping helps organizations measure and transform all aspects of their business, people and culture. Perception Mapping allows to represent the complex relationships graphically, helps identify potential problems of the organization and make the best decisions.
Picture: Business Tools Perceptual Mapping
Related Solution:
Follow samples and map templates to create nfographic maps. It's super-easy!
Picture: Map Infographic Creator
You need to draw a Functional Flow Block Diagram? You are an artist? Now it doesn't matter. With Block Diagrams solution from the Diagrams area for ConceptDraw Solution Park you don't need more to be an artist to design the Functional Flow Block Diagram of any complexity.
Picture: Functional Flow Block Diagram
Related Solution:
What is organizational charts and why your business need them? How to use business process diagram software? Explore how advanced organization chart software transforms the way companies ✔️ visualize, ✔️ communicate, and ✔️ streamline their organizational hierarchies
Picture:
What is an Organizational Chart and how it works?
Organization Chart Software
Related Solution:
UML Activity Diagram illustrate the business and operational step-by-step workflow of components in a system and shows the overall flow of control.
Picture: UML Activity Diagram. Design Elements
While creating flowcharts and process flow diagrams, you should use special objects to define different statements, so anyone aware of flowcharts can get your scheme right. There is a short and an extended list of basic flowchart symbols and their meaning. Basic flowchart symbols include terminator objects, rectangles for describing steps of a process, diamonds representing appearing conditions and questions and parallelograms to show incoming data.
This diagram gives a general review of the standard symbols that are used when creating flowcharts and process flow diagrams. The practice of using a set of standard flowchart symbols was admitted in order to make flowcharts and other process flow diagrams created by any person properly understandable by other people. The flowchart symbols depict different kinds of actions and phases in a process. The sequence of the actions, and the relationships between them are shown by special lines and arrows. There are a large number of flowchart symbols. Which of them can be used in the particular diagram depends on its type. For instance, some symbols used in data flow diagrams usually are not used in the process flowcharts. Business process system use exactly these flowchart symbols.
Picture: Flowchart Symbols: Meaning and Examples
Related Solution:
Once you have created your document in ConceptDraw DIAGRAM and you want to share it with your colleagues and friends, who uses MS Visio on their computers, you can easily export your document using ConceptDraw DIAGRAM export to Visio XML files (VDX) feature.
Now you can share your ConceptDraw documents with MS Visio users.
Picture: Export from ConceptDraw DIAGRAM Document to MS Visio® XML