VSM
“ Value stream mapping is a lean-management method for analyzing the current state and designing a future state for the series of events that take a product or service from its beginning through to the customer. At Toyota, it is known as "material and information flow mapping". It can be applied to nearly any value chain.” [from Wikipedia]
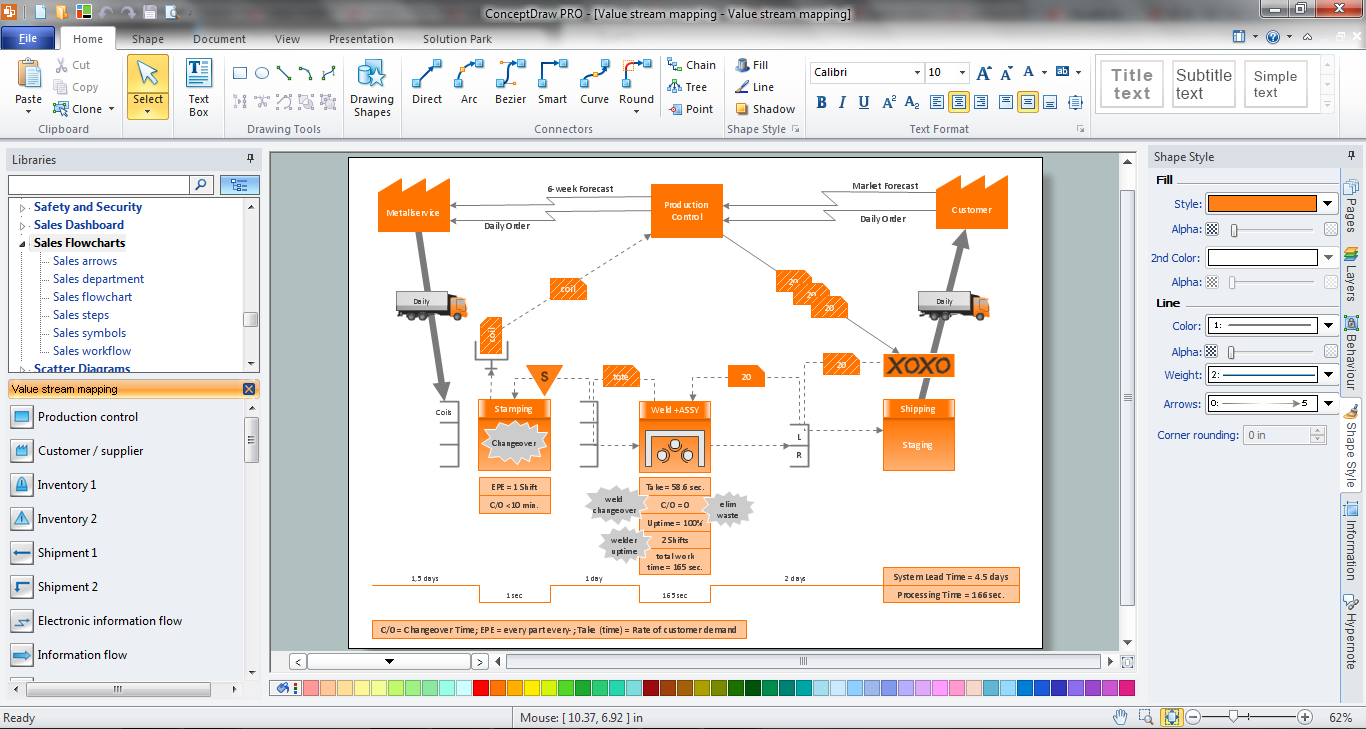
ConceptDraw DIAGRAM diagramming and vector drawing software extended with Value Stream Mapping solution from the Quality area of ConceptDraw Solution Park is effective for implementation a value stream mapping (VSM) process and for creating Value Stream Maps.
Example 1. Value Stream Mapping (VSM) Sample
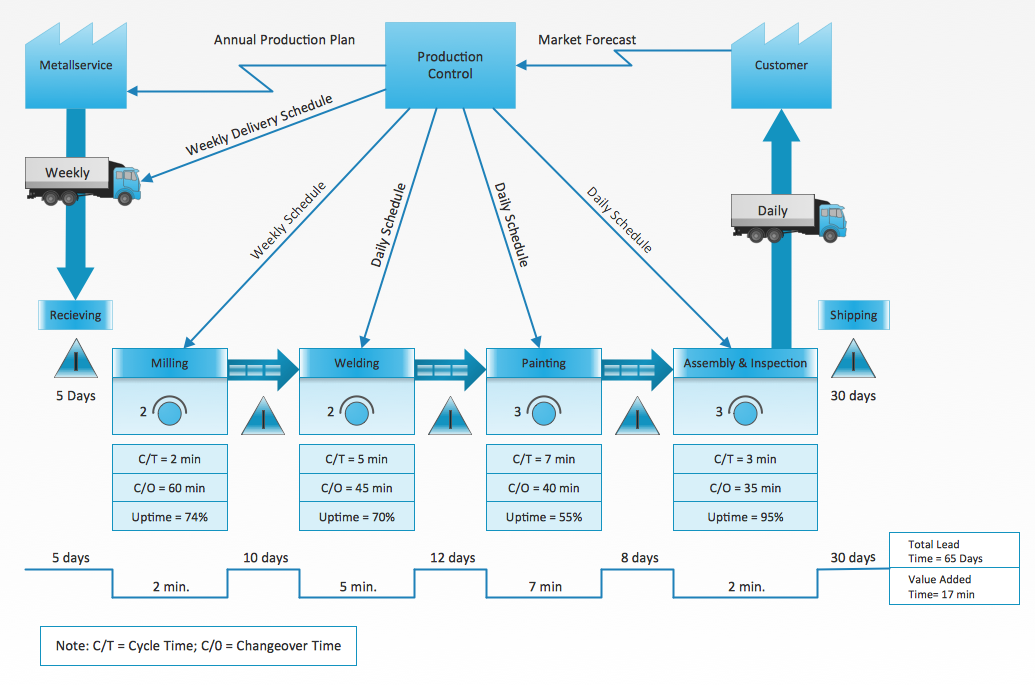
Value Stream Mapping Solution offers a Value Stream Mapping library with wide collection of predesigned VSM vector elements. They are incredibly helpful for Value Stream Mapping.

Example 2. Value Stream Mapping Library Design Elements
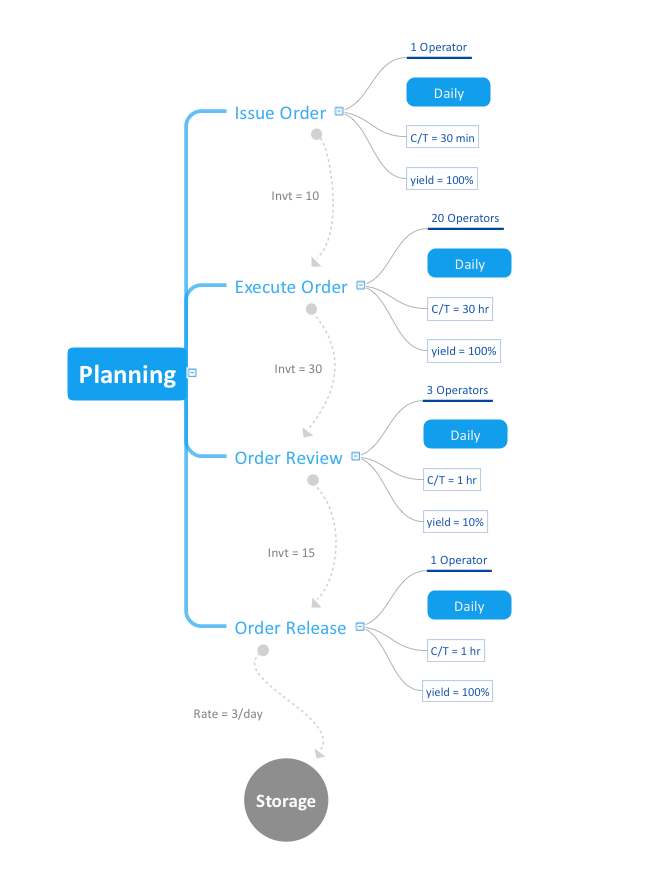
Simply create new document, drag the needed objects from the library and arrange them to make your own professional looking and successful Value Stream Map (VSM). Another way of drawing is to fill the predesigned template included in Value Stream Mapping solution.

Example 3. Value Stream Map (VSM) Template
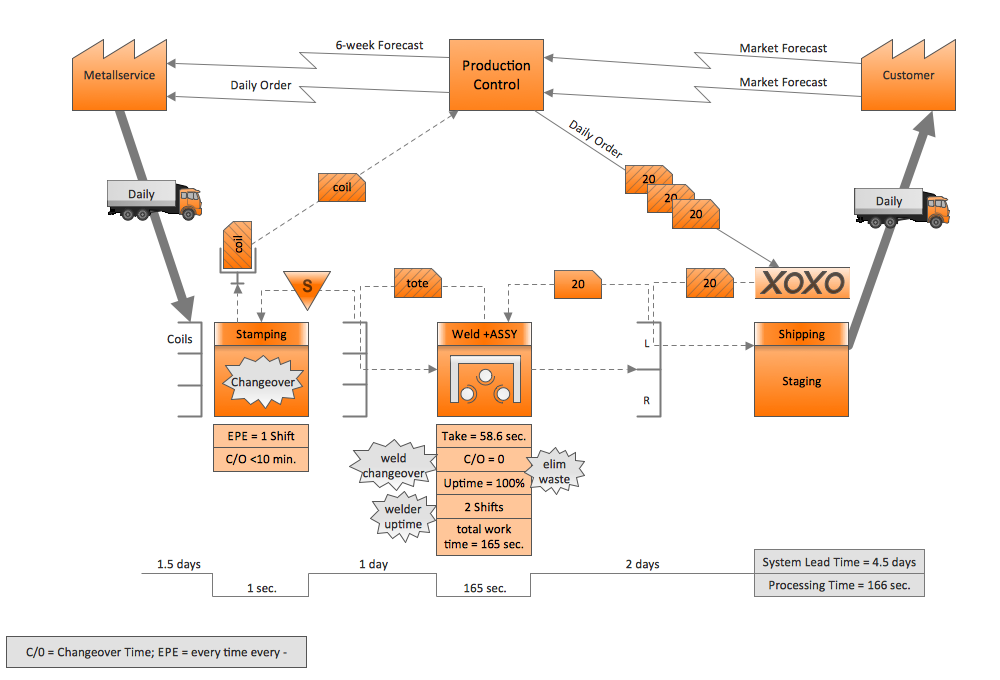
The VSM sample and template you see on this page were created in ConceptDraw DIAGRAM software using the extensive tools of the Value Stream Mapping solution and were included in it. You can find them in ConceptDraw STORE.
Use the Value Stream Map Solution for quick, easy and effective creating various Value Stream Maps, and then successfully use them in work activity.
All source documents are vector graphic documents. They are available for reviewing, modifying, or converting to a variety of formats (PDF file, MS PowerPoint, MS Visio, and many other graphic formats) from the ConceptDraw STORE. The Value Stream Map Solution is available for all ConceptDraw DIAGRAM or later users.
SIX RELATED HOW TO's:
While creating flowcharts and process flow diagrams, you should use special objects to define different statements, so anyone aware of flowcharts can get your scheme right. There is a short and an extended list of basic flowchart symbols and their meaning. Basic flowchart symbols include terminator objects, rectangles for describing steps of a process, diamonds representing appearing conditions and questions and parallelograms to show incoming data.
This diagram gives a general review of the standard symbols that are used when creating flowcharts and process flow diagrams. The practice of using a set of standard flowchart symbols was admitted in order to make flowcharts and other process flow diagrams created by any person properly understandable by other people. The flowchart symbols depict different kinds of actions and phases in a process. The sequence of the actions, and the relationships between them are shown by special lines and arrows. There are a large number of flowchart symbols. Which of them can be used in the particular diagram depends on its type. For instance, some symbols used in data flow diagrams usually are not used in the process flowcharts. Business process system use exactly these flowchart symbols.
Picture: Flowchart Symbols: Meaning and Examples
Related Solution:
ConceptDraw - Organigram software allows quickly create Organigrams and much more. ConceptDraw DIAGRAM is an ideal tool for Administrative staff to clearly demonstrate the company orgchart professional.
Picture: Organigrams with ConceptDraw DIAGRAM
Related Solution:
If you need to pull together a quick marketing drawing, you'll find elements, samples, templates and libraries with vector clip art for drawing the Marketing Illustrations.
These symbols and signs you can use in your design for Strategic Marketing, Graphic Design, Inbound and Content Marketing, Social Media, Lead Generation, Email Marketing and Automation, CRM implementation and Integration and more.
Picture: Marketing - Design Elements
Related Solution:
Every good manager has to predict different situations that might occur in any process. If only every of them Swot Analysis Examples at that time, I could have succeeded in my career. Unfortunately I didn't have any notion about it.
This is a sample of SWOT diagram. This is also a mean of marketing strategy elaboration. Before as filling this table, marketing manager has to investigate both external and internal factors. The effective SWOT analysis helps to gain benefits from opportunities and decrease threats by conversion of strengths and weaknesses into advantage. The SWOT and TOWS Analysis solution to ConceptDraw offers a number of template matrices for SWOT, designed to support a marketing strategy development process.
Picture: Swot Analysis Examples
ConceptDraw DIAGRAM extended with Matrices solution from the Marketing area of ConceptDraw Solution Park is the best Deployment Chart Software.
The Matrices solution offers you the useful tools for creating Deployment Charts in just minutes.
The Deployment Charts designed with ConceptDraw DIAGRAM are vector graphic documents and are available for reviewing, modifying, converting to a variety of formats (image, HTML, PDF file, MS PowerPoint Presentation, Adobe Flash or MS Visio XML), printing and send via e-mail in one moment.
Picture: Deployment Chart Software
Related Solution:
Use ConceptDraw Value Stream Maps (VSM) visualization for a manufacturing plant the material and information flow required to deliver a product or service to customers
Picture: Value Stream Mapping
Related Solution: