Measure the Progress
Sales Dashboard Solution
ConceptDraw DIAGRAM is a software for making dashboards for measuring various KPI's. The Sales Dashboard Solution include allows users to use live data in the dashboards. The clean and dynamic dashboard objects are driven by data files, and are updated automatically as the data changes.
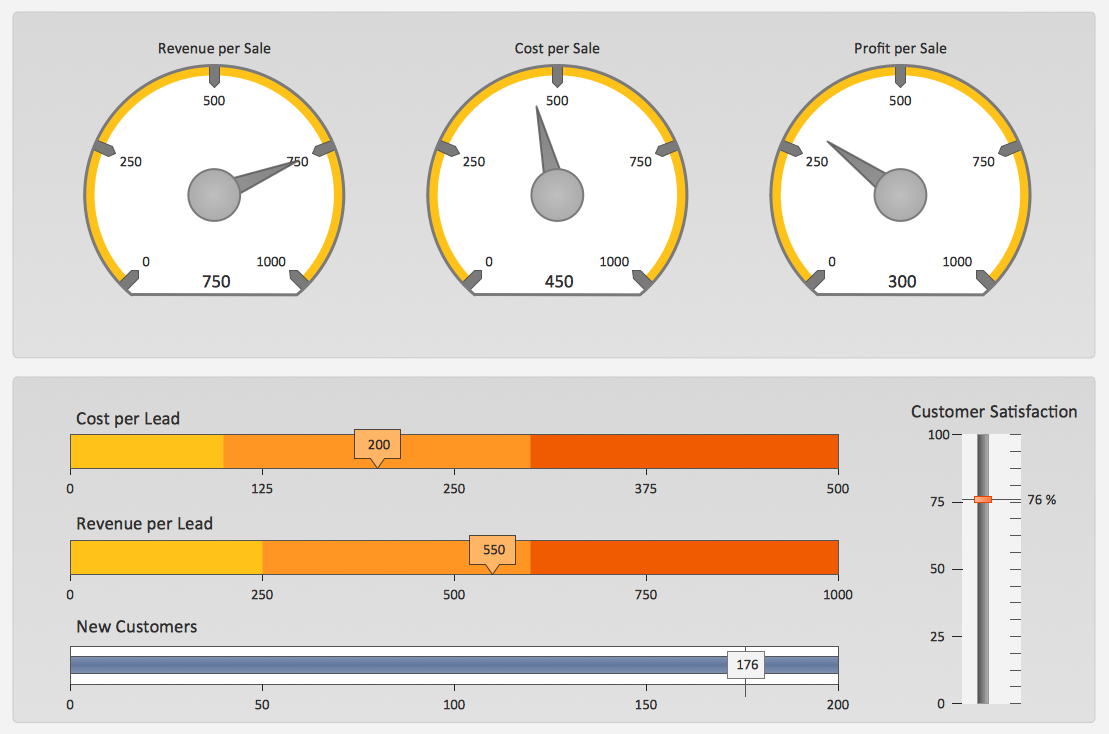
Pic. 1. Sales KPIs Dashboard Sample
THREE RELATED HOW TO's:
Customer relationship management is an important component of sales success. Visualizing sales data you may put some KPI related to customers relationship management to your Sales dashboard and track this important aspect in real time.
Picture: Customer Relationship Management
ConceptDraw DIAGRAM is a business intelligence dashboard software that allows you produce sales dashboard that suites your specific needs. To see how your business can improve with sales dashboards select KPI and start tracking it.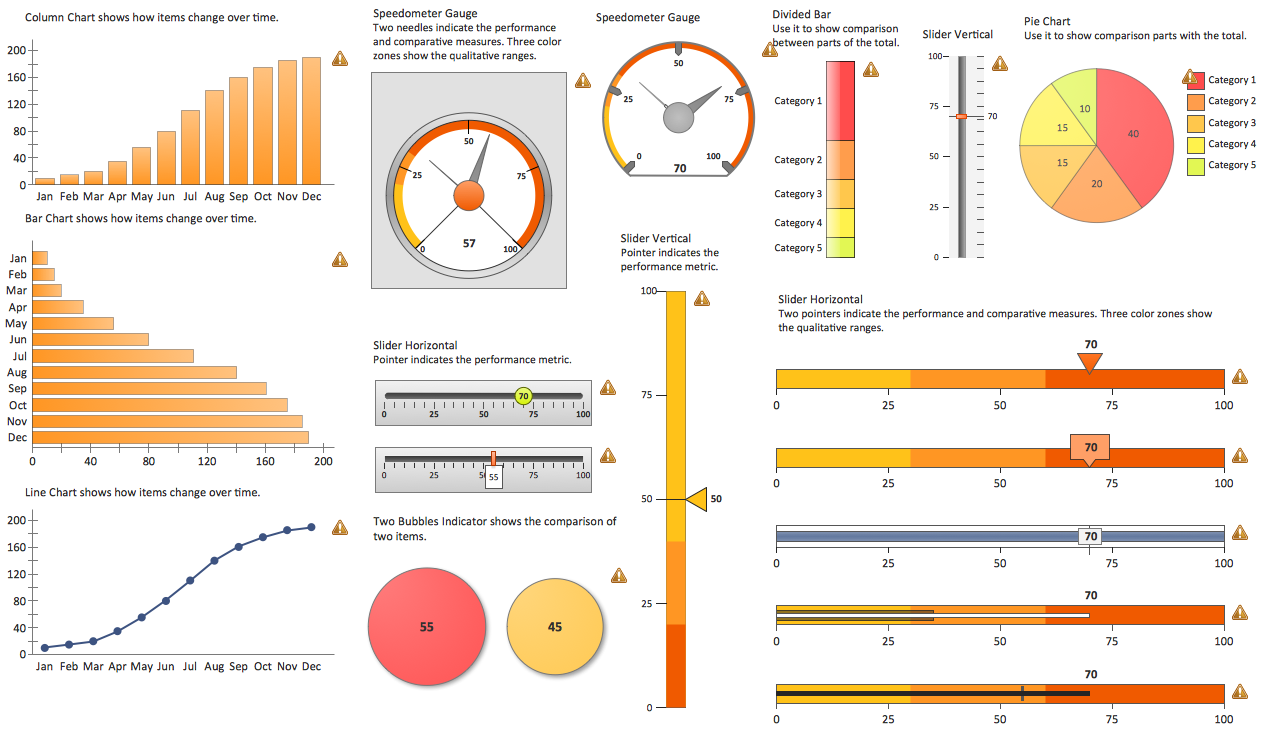
Picture: Business Intelligence Dashboard Software
A combination of sales KPI on a one dashboard helps you track sales activities and results. Visualizing sales data using ConceptDraw DIAGRAM software extended with the Sales Dashboard solutiongives you flexibility in choosing and tuning KPIs.
Picture: Sales KPI Dashboards
ConceptDraw
DIAGRAM 18