Risk diagram (process decision program chart, PDPC) helps you to identify risk factors and define preventive actions.
TEN RELATED HOW TO's:
Learn the most common process flowchart symbols used in business process diagrams and workflow charts. Includes symbol meanings, examples, and a practical reference table.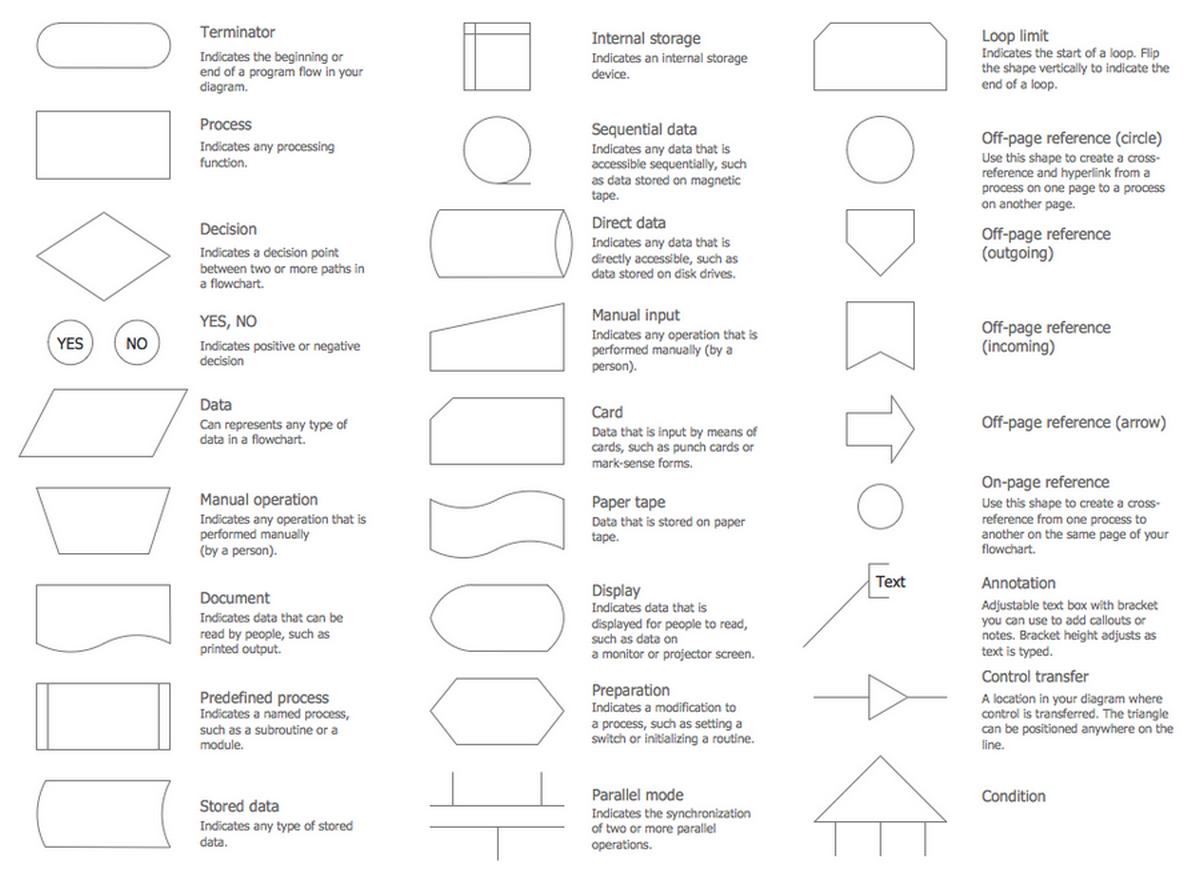
Picture: Process Flowchart Symbols: Meaning, Types and Examples
Related Solution:
ConceptDraw DIAGRAM is the beautiful design software that provides many vector stencils, examples and templates for drawing different types of illustrations and diagrams.
Mathematics Solution from the Science and Education area of ConceptDraw Solution Park includes a few shape libraries of plane, solid geometric figures, trigonometrical functions and greek letters to help you create different professional looking mathematic illustrations for science and education.

Picture: Scientific Symbols Chart
Related Solution:
Any building project must respond to some requirements. Moreover, finding a drawing software for developing a waste water plan is significant. Designing plumbing plans may be difficult in the beginning, but practice makes perfect.
Layout of plumbing fixtures and, kitchen equipment a is a very important part of the home's interior design. If you do not want to find out suddenly the bath in your kitchen, or stove in your bathroom, you need to pay due attention to this plan. ConceptDraw Building Plans libraries give you a number of vector objects. Using them you can quickly and professionally sketch a plan of kitchen or bathroom in proper scale and with objects depicting your desired equipment. Then your contractor never will confuse a bath with a stove and a washing machine with a toilet and your house will be really a home of your dreams.
Picture: Building Drawing Software for Designing Plumbing
Related Solution:
Use Case Diagrams technology. IDEF3 Standard is intended for description and further analysis of technological processes of an enterprise. Using IDEF3 standard it is possible to examine and model scenarios of technological processes.
Picture: IDEF3 Standard
ConceptDraw DIAGRAM is a powerful drawing and vector diagram maker software that allows to design the professional looking Influence Diagrams quick and easy.
Picture: Influence Diagram Software
Related Solution:
Chore chart. Draw perfect-looking chore chart. Free chore chart samples. All about chore charts.
Picture: Chore charts with ConceptDraw DIAGRAM
ConceptDraw DIAGRAM is a powerful tool that helps you create professional looking cross-functional flowcharts with the well-designed objects. ConceptDraw DIAGRAM - Drawing Software for Vertical Cross Functional Flowchart. ConceptDraw allows you to focus on work, not the drawing process. ConceptDraw Arrows10 Technology allows to draw connectors with smart behavior that gives flexibility to you during work process.
Picture: Vertical Cross Functional Flowchart
At the base of the identity of an organisational is its organizational culture.
Picture: Pyramid Diagram
Related Solutions:
Accounting flowchart is a pictorial way to represent the flow of data in an organization and the flow of transactions process in a specific area of its accounting or financial department. Accounting Flowcharts solution contains the full set of standardized accounting flowchart symbols which will help you design in minutes various types of Accounting Flowcharts including such popular diagrams which represent the whole accounting process: Purchasing Flowchart, Receiving Flowchart, Voucher Payable Flowchart, Treasurer Flowchart, Payment Flowchart.
Picture: Accounting Flowchart Purchasing Receiving Payable and Payment
Related Solution:
Designing a workspace or office involves careful consideration of form and function. Conceptdraw offers you all nessesary office design elements in one library. Combine, match, design and create!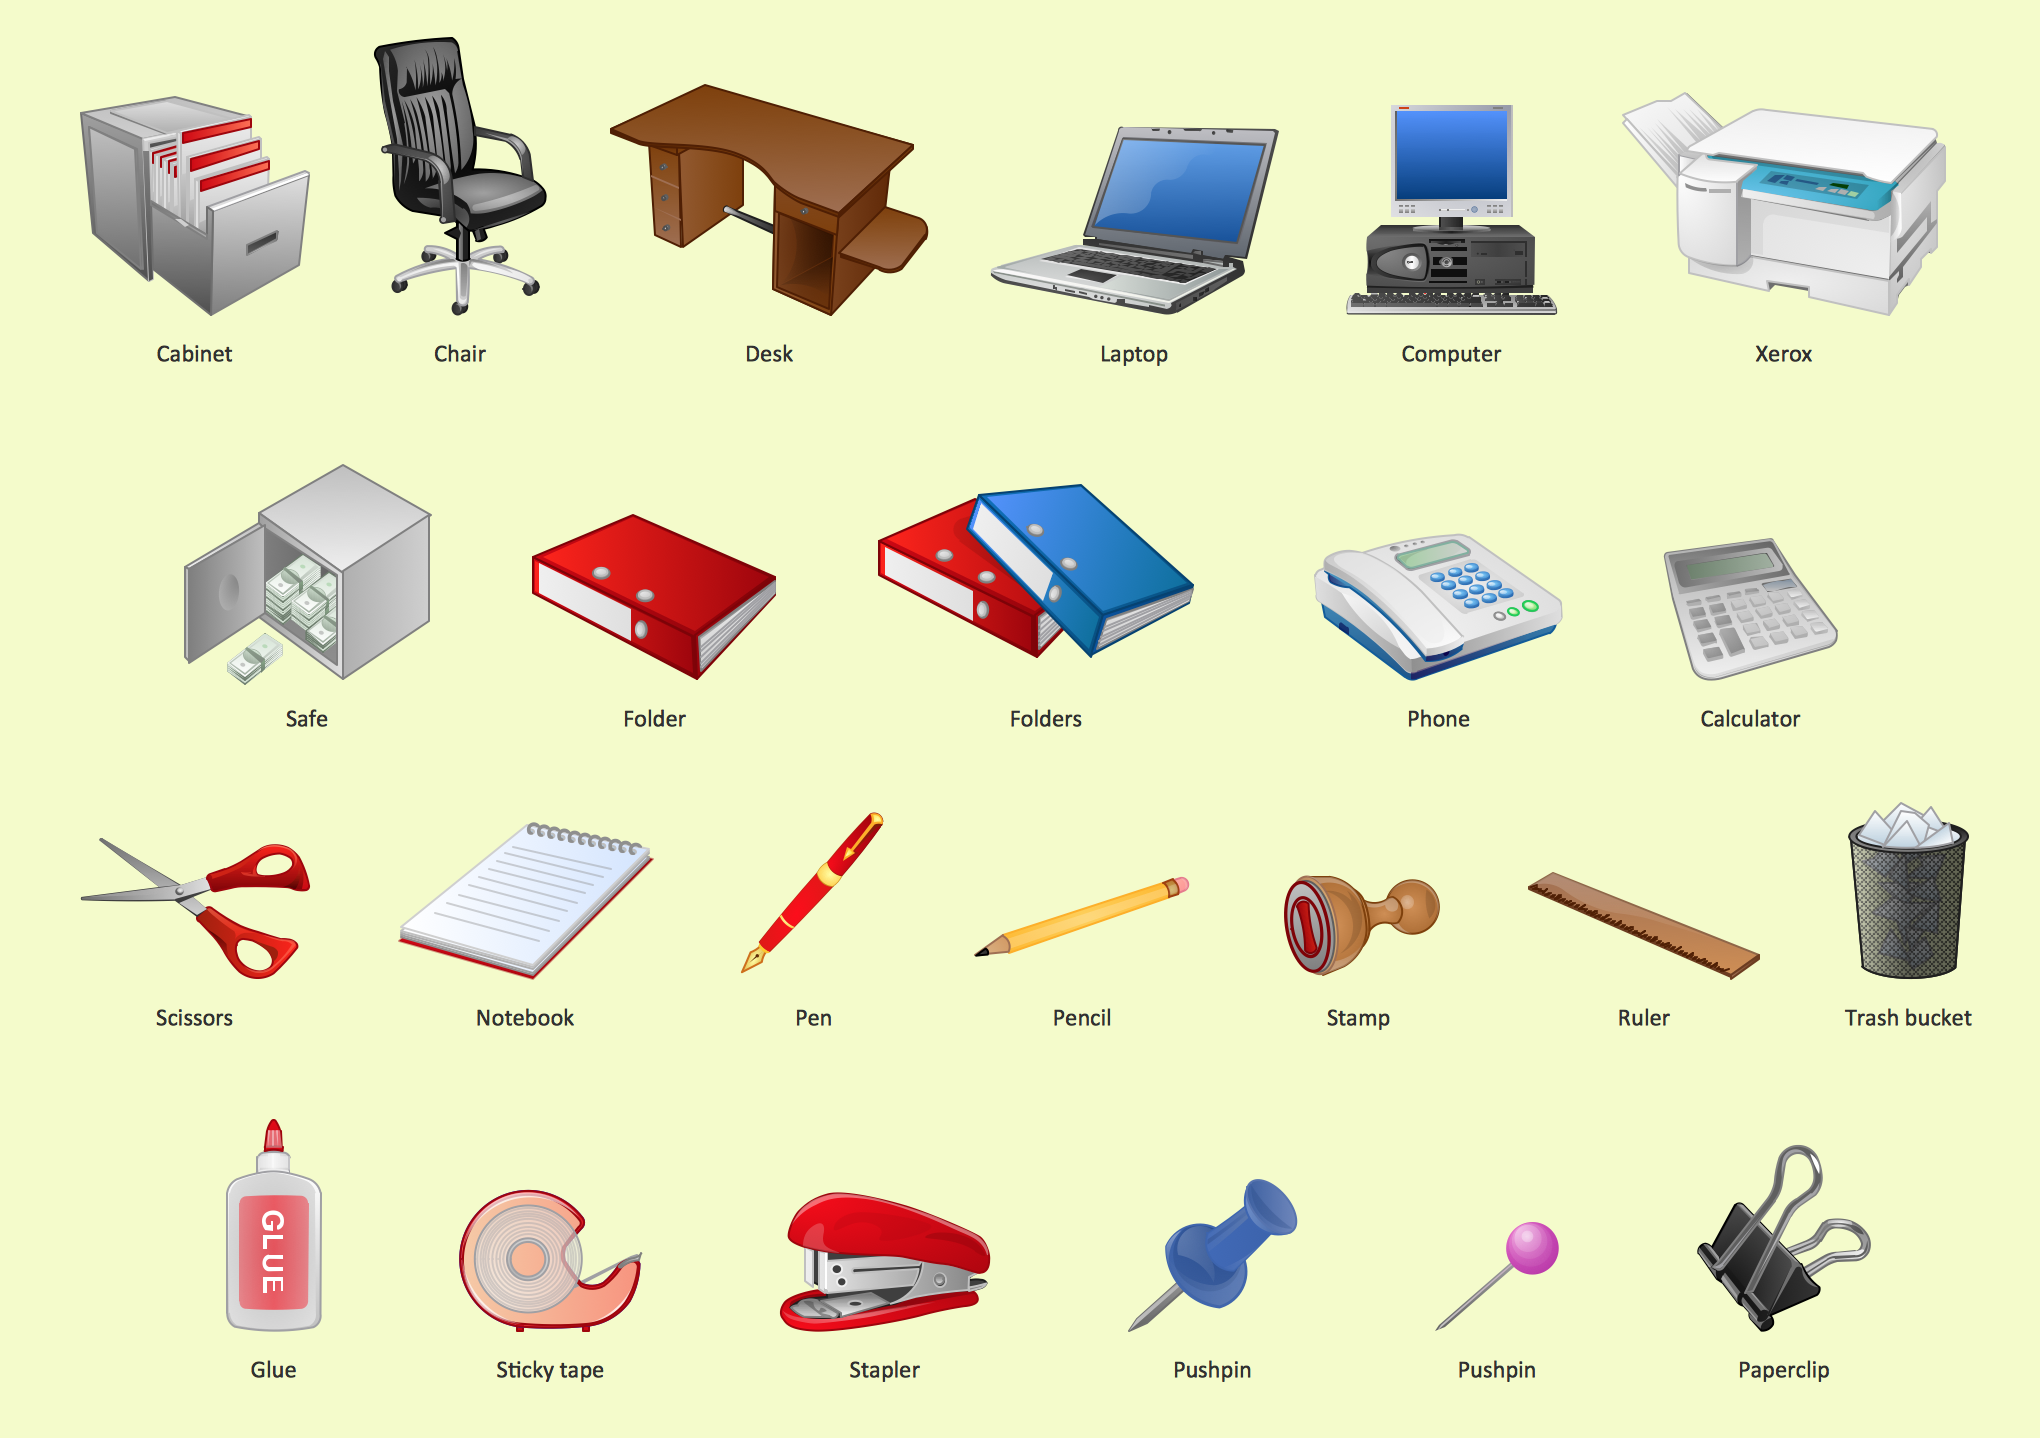
Picture: Office - Design Elements
Related Solution:
