HOQ
Modular function deployment, same as the decision-matrix method, can be used within the quality function deployment activity, but one of the most popular methods nowadays is the so-called “House of Quality”.
Modular function deployment is known to be consisting of five major steps, starting with the so-called “quality function deployment analysis” used for establishing the customers’ requirements as well as for identifying all the important design requirements, being mainly focused on modularity. The functional requirements on the product can be analyzed and the technical solutions can be selected.
All mentioned can be followed by the systematic selection and generation of the modular concepts, in which the module indication matrix can be used. The mentioned matrix can help identify all the possible modules by examining all the possible interrelationships between both technical solutions and the so-called “module drivers”.
Module indication matrix can also provide the special mechanisms for investigating the opportunities of integrating different functions into the single modules. An evaluation can be carried out for each of the modular concepts and the expected effects of the redesign can be estimated. The module indication matrix can be always re-used after for identifying the opportunities for all the further improvements to the single modules.
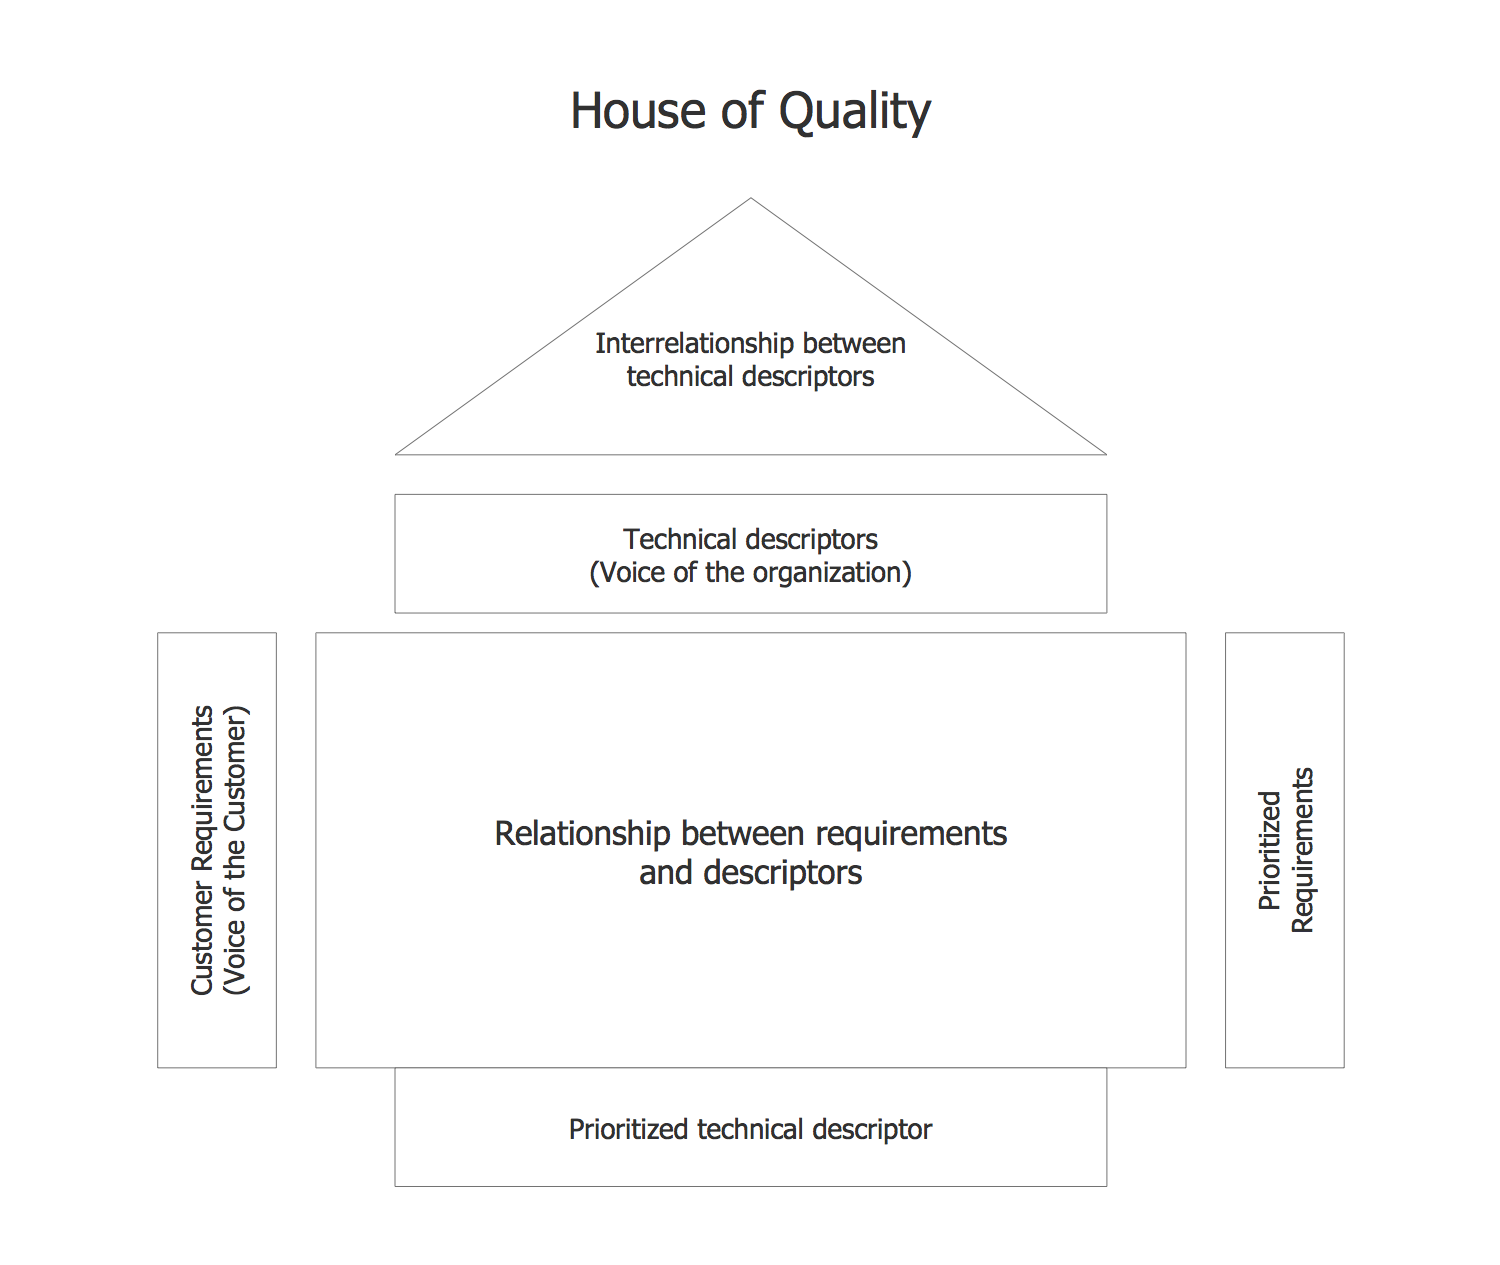
Pic. 1. House of Quality HOQ
Next, the decision-matrix method can be also known as the Pugh Concept Selection or Pugh method as it was invented by S. Pugh. It is a qualitative technique that can be used for ranking the dimensional options of some particular set of options. It can be used in engineering for making the needed design decisions as well as for ranking the investment options, product options, vendor options, as well as any other set of the multidimensional entities.
Any decision matrix is known to be consisting of establishing some particular set of criteria options which can be scored as well as summed in order to gain a total score which can be ranked after. Although it is quite a popular method, it cannot be weighted in order to allow a quick selection process.
At the same time, any weighted decision matrix is known to be operating in the same way as the basic decision one. The only difference is that it introduces the concept of weighting the criteria depending on its importance. The final scores can better reflect the importance to the decision maker of the criteria that are involved. The more important the criteria, the higher weighting it should be given. Each of the potential options can be scored and multiplied after by weighting.
The subjective opinions that may be made more objective and the needed sensitivity studies can be performed with its help. These mentioned points are known to be the advantages of the decision-making matrix. A so-called “morphological analysis” is known to be another form of any decision matrix. It employs a so-called multi-dimensional configuration space that is known to be linked by way of the logical relationships.
Despite the popularity of the previously described methods, the House of Quality one still seems to be the most used one as it can both identify and classify all the customers’ desires, identifying their importance and engineering characteristics which may be relevant to those desires. This process can be always applied at any system composition level, such as component or subsystem, allowing for the assessment of different abstractions of one system.
A matrix with correlated non-functional requirements on one dimension and customer desires on the other dimension is what the output of the “house of quality” is. A non-functional requirement within the systems engineering is simply a requirement that can be used for specifying some criteria to use to judge some operation of a system. It does not judge any behavior in particular, but an operation as a whole.
Any non-functional requirement can be contrasted with the functional ones which can define some definite functions and behavior. In the system design, the plan for implementing functional requirements should be the more detailed the better so it can be easily used for implementing the non-functional requirements in the system architecture.
Non-functional requirements are often called "quality attributes" of a system. Other terms for non-functional requirements are "qualities", "quality goals", "quality of service requirements", "constraints" and "non-behavioral requirements". Informally these can be also called as the "ilities", from attributes such as portability and stability. The qualities can be divided into two main categories which are execution and evolution ones. First ones are safety, usability, security and other ones, which can be observable during operation and the second type may include testability, extensibility, scalability and maintainability, — those which can be embodied in the static structure of the system.
The cells of the House of Quality matrix table should be filled with the weights that are assigned to the stakeholder characteristics. Those characteristics are normally affected by the system parameters across the whole top of the matrix. At its bottom, the column is summed. It allows the system characteristics to be weighted depending on the overall stakeholder characteristics.

Pic. 2. House of Quality solution
There are many other nuances about the HOQ matrix as well as other HOQ drawings, such as the HOQ diagrams, which you can read in a few more articles on this site. In case you want to create one of such drawings, you can always use any of the available for all the ConceptDraw DIAGRAM users templates from the ConceptDraw STORE application and the House of Quality solution in particular.


