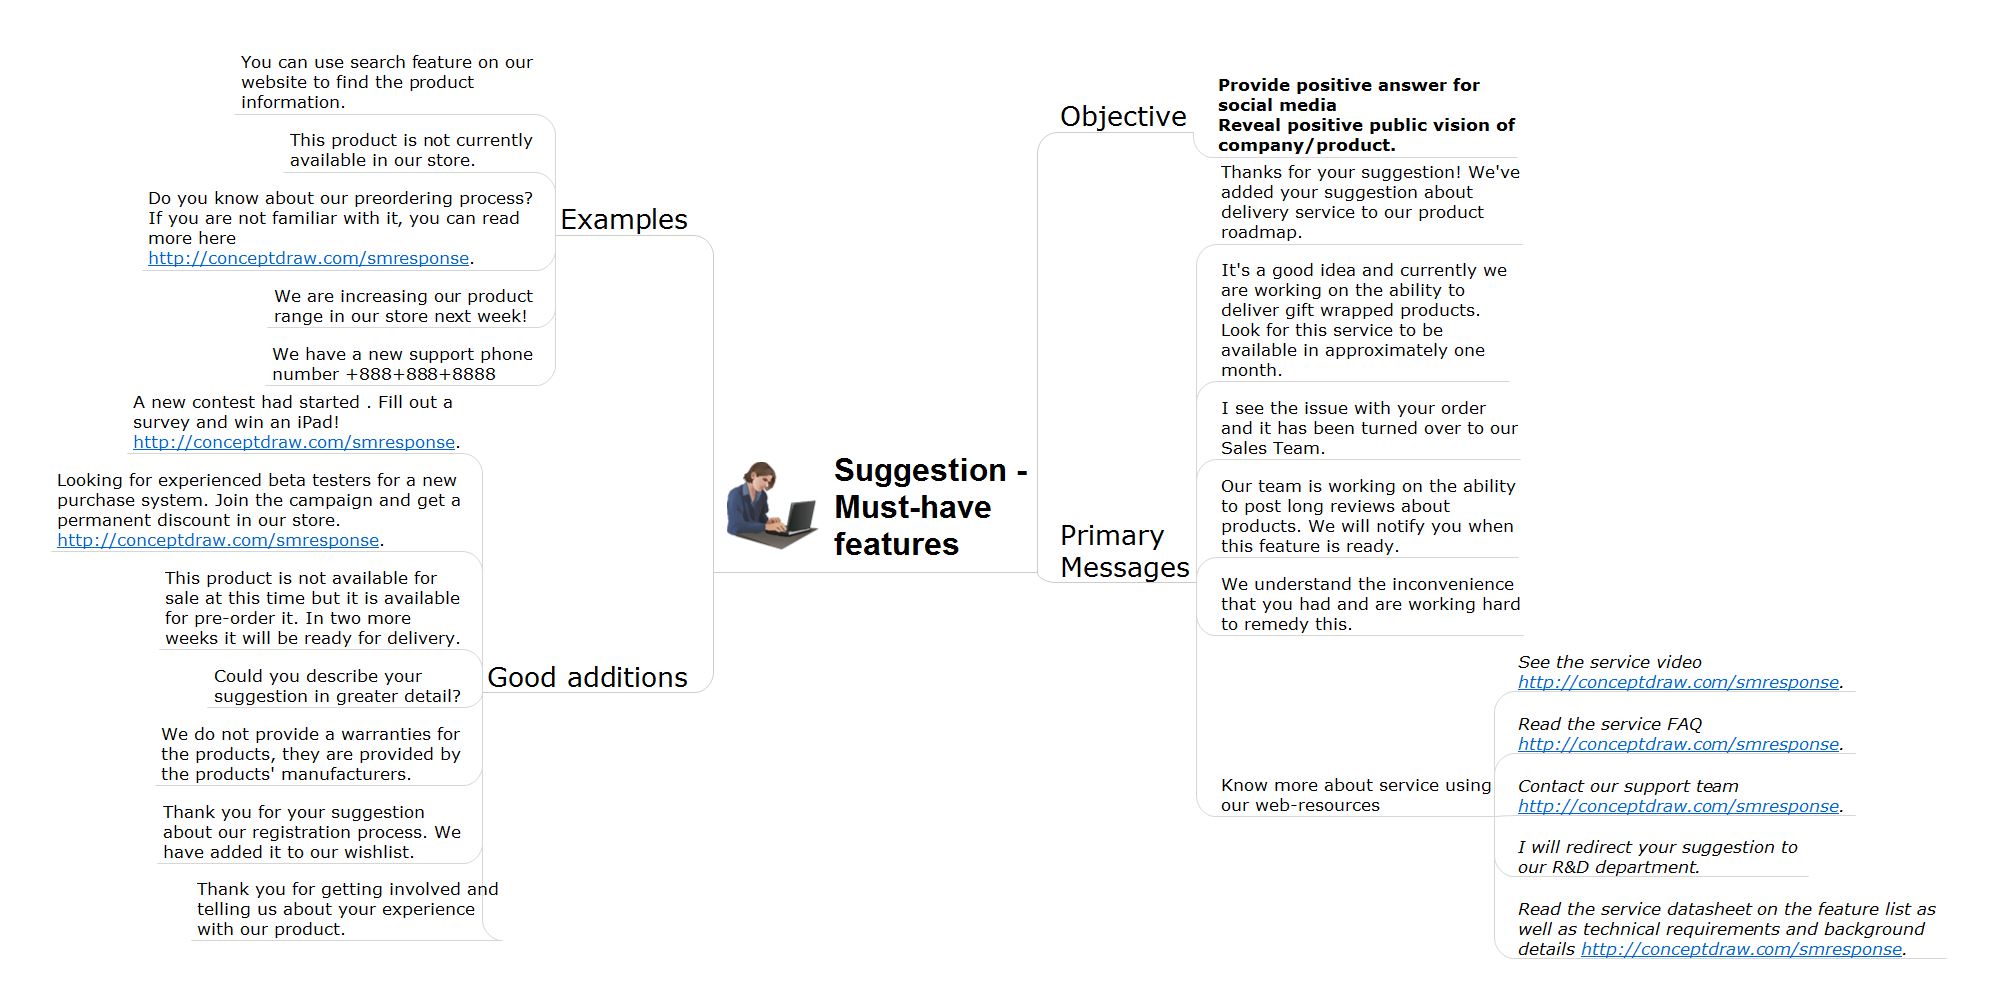
Action Maps helps the teams be on the same page and follow the social media response plan.
TEN RELATED HOW TO's:
Users new to ConceptDraw PROJECT will find the Basic lessons an essential platform for familiarizing themselves with the program′s functions. This video lesson will teach you how to set up task trees and dependencies.
Picture: Project —Task Trees and Dependencies
This template shows the restaurant floor plan for kids. The floor plans are necessary for architects, builders, designers. It’s very simple, convenient and quick to design the professional looking Floor Plans of any difficulty in ConceptDraw DIAGRAM.
Use the ready-to-use predesigned objects, templates and samples from the Floor Plans Solution for ConceptDraw DIAGRAM you can create your own Floor Plans quick and easy.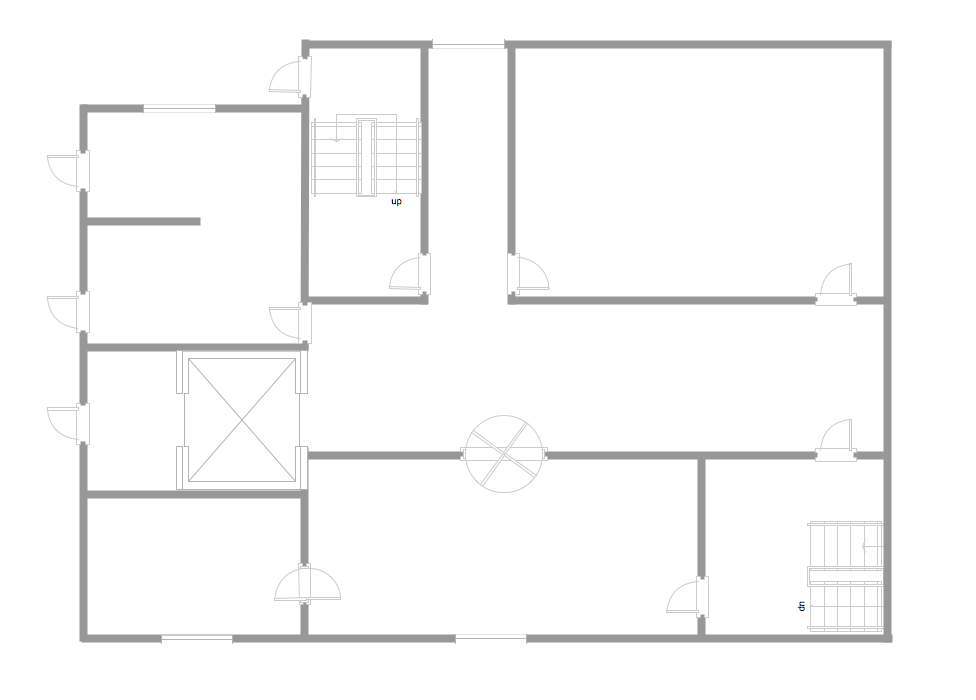
Picture: Template Restaurant Floor Plan for Kids
Related Solution:
One of the most popular option helps to draw diagrams faster is pre-designed set of examples related to each kind of diagram. ConceptDraw DIAGRAM software extended with the Workflow Diagrams solution delivers a complete set of workflow process examples helps you to start making your own workflow faster.
Picture: Workflow Process Example
Related Solution:
A flowchart is a simple but very functional tool when it comes to understanding a workflow or to removing unnecessary stages from a process. When drawing flowcharts, keep in mind that there are four common types of flowcharts, like document flowcharts and data flowcharts that show control over a data or document flow over a system. To show controls on a physical level, use system flowcharts. In addition, to show controls in a program, you can draw a program flowchart.
This flowchart diagram represents the piece of an article editing process, that involves the author and editor. It was created using the Basic Flowchart notation that consists from the basic flowchart symbols. The start and the end of the process are indicated with "Terminator" symbols. The "Process" symbols show the action steps consisting from making edits and searching for a compromise, when the author does not agree with the suggestions of the editor. The "Process" symbol is the general symbol in process flowcharts. The "Decision" symbol indicates a branching in the process flow. There are two branches indicated by a Decision shape in the current flowchart (Yes/No, Disagree/Agree). This basic flowchart can be used as a repeating unit in the workflow diagram describing the working process of some editorial office.
Picture: Types of Flowcharts
Related Solution:
In any unclear situation create a workflow diagram. Workflow diagrams help to understand processes, find bottlenecks and fix the process. When you create workflow diagram using ConceptDraw DIAGRAM software you are able to focus on thinking, not drawing, that makes you as effective as possible.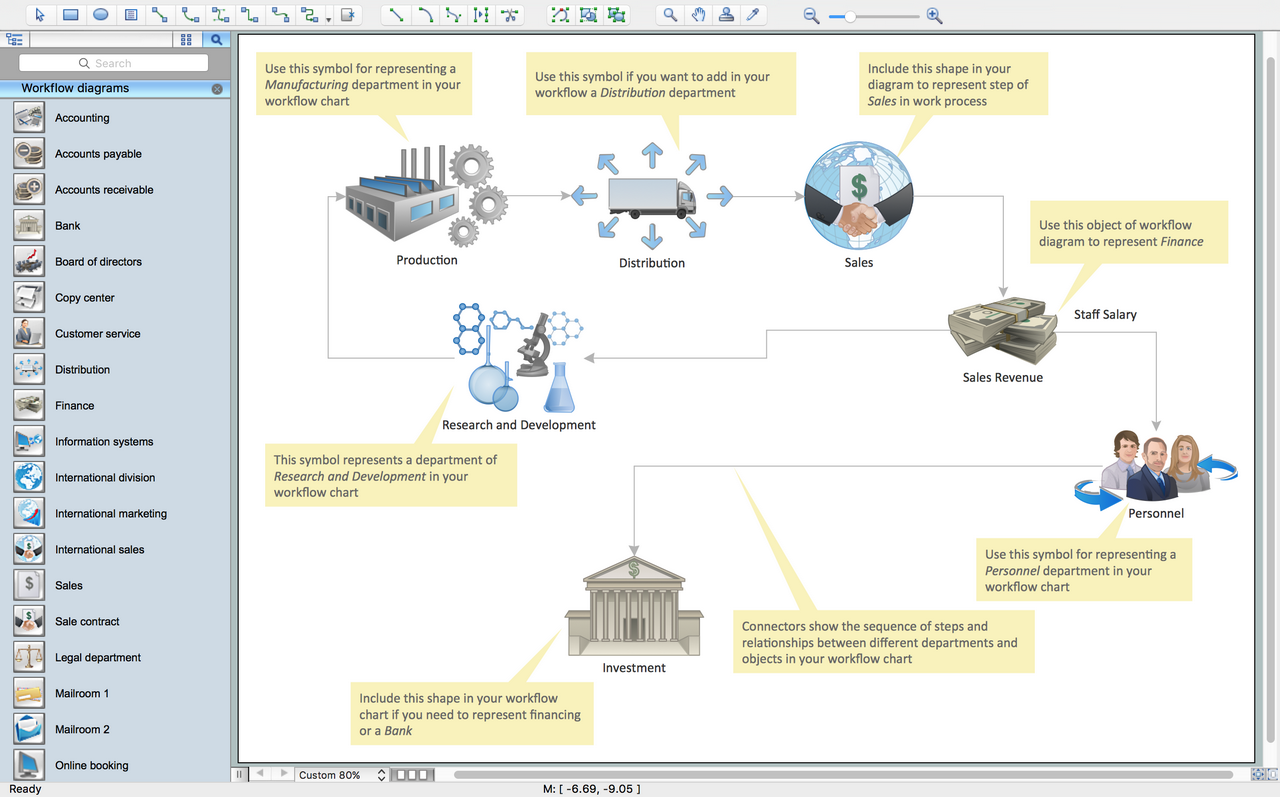
Picture: Create Workflow Diagram
Related Solution:
Sales process engineering is a complex and labour-intensive process which requires a lot of time, efforts, and powerful software. We recommend to use the ConceptDraw DIAGRAM software enhanced with Sales Flowcharts solution from the Marketing area of ConceptDraw Solution Park. It gives the possibility to easy illustrate all sales process steps and their results.
Picture: Sales Process Steps
Related Solution:
ConceptDraw DIAGRAM is a powerful intelligent vector graphics engine that can be used to create basic diagrams including flowcharts, charts, workflows, flowcharts, organizational charts, business diagram, learn business diagrams, flow diagrams.
Picture: The Best Mac Software for Diagramming or Drawing
Related Solution:
This sample shows the Flowchart that displays the layout and work flow of the cloud marketing platform. This diagram has a style of the marketing brochure. This style displays the central product that is related to the other issues.
Using the ready-to-use predesigned objects, samples and templates from the Flowcharts Solution for ConceptDraw DIAGRAM you can create your own professional looking Flowchart Diagrams quick and easy.
Picture: Flowchart Marketing Process. Flowchart Examples
Related Solution:
Use ConceptDraw MINDMAP for creative thinking, planning, organization, problem solving, presentations, decision making, note taking, team brainstorming and other tasks.
Picture: Applications
ConceptDraw DIAGRAM application is perfect for creating workflow diagrams. This application contains specific features and technologies designed to draw diagrams faster, such as RapidDraw and Arrows10. ConceptDraw DIAGRAM software extended with the Workflow Diagrams solution gives you a flexible tool to draw any kind of workflow.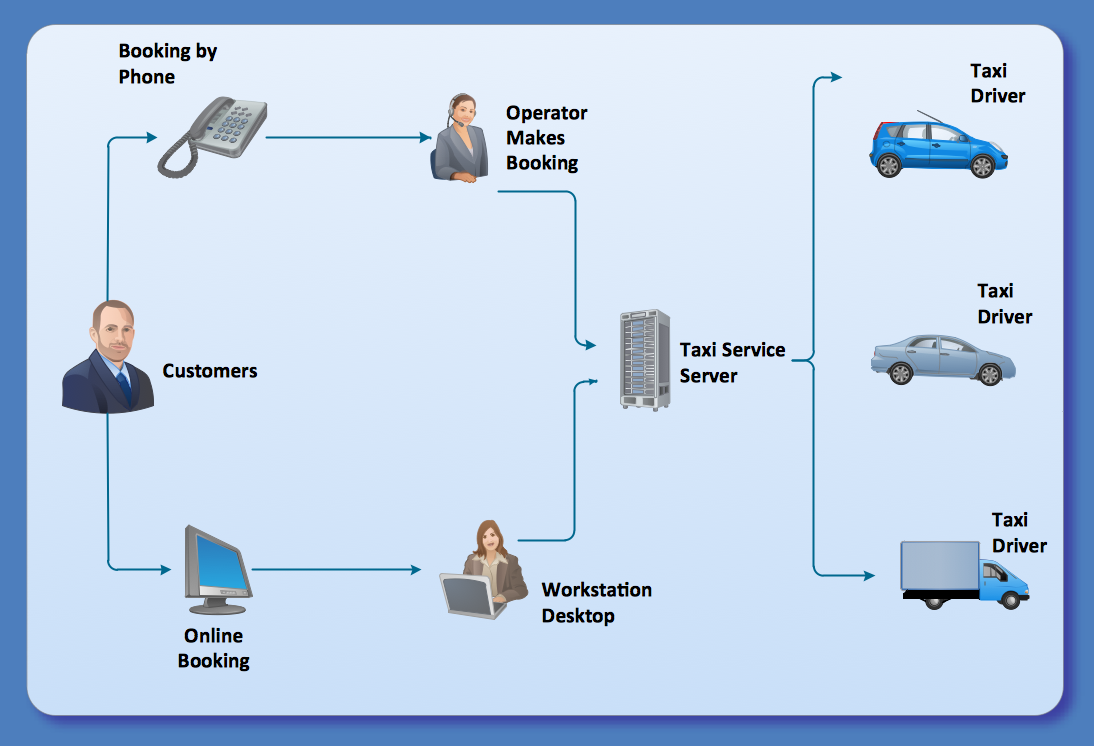
Picture: Workflow Application
Related Solution: