")
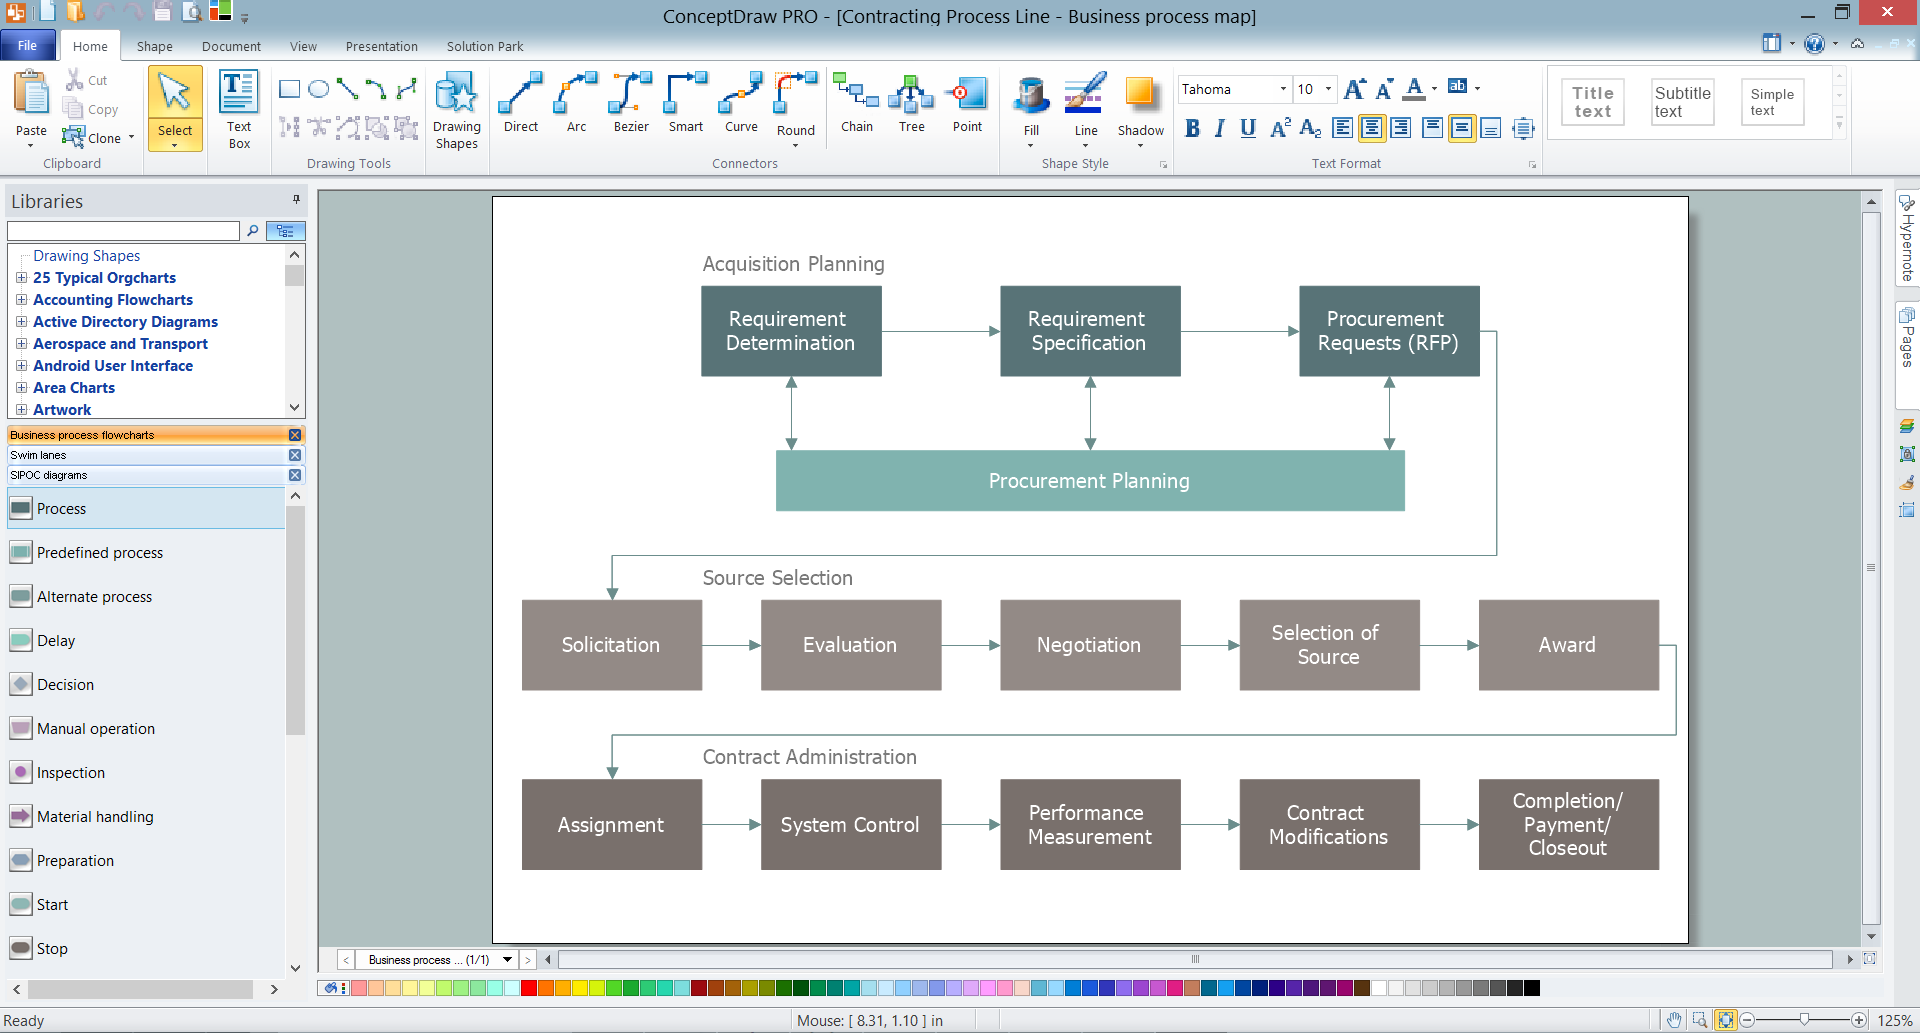
Example 1. ConceptDraw DIAGRAM - Business Mapping Software
Pay your attention for 3 libraries developed and included in Business Process Mapping Solution! They provide great quantity of ready-to-use vector design elements for easy drawing business process flowcharts, diagrams and maps of any complexity.
Use this variety of vector objects from the libraries of Business Process Mapping Solution for ConceptDraw DIAGRAM Business Mapping Software and also collection of Business Process Maps, Flowcharts, Swim Lanes Diagrams and SIPOC Diagrams, and template from ConceptDraw STORE to create your own professional looking diagrams of any complexity quick, easy and effective.

Example 2. Business Process Mapping Solution in ConceptDraw STORE
The following features make ConceptDraw DIAGRAM the best Business Mapping Software:
- You don't need to be an artist to draw professional looking maps in a few minutes.
- Large quantity of ready-to-use vector objects makes your drawing diagrams quick and easy.
- Great number of predesigned templates and samples give you the good start for your own maps and diagrams.
- ConceptDraw DIAGRAM provides you the possibility to use the grid, rules and guides. You can easily rotate, group, align, arrange the objects, use different fonts and colors to make your diagram exceptionally looking.
- All ConceptDraw DIAGRAM documents are vector graphic files and are available for reviewing, modifying, and converting to a variety of formats: image, HTML, PDF file, MS PowerPoint Presentation, Adobe Flash, MS Visio.
- Using ConceptDraw STORE you can navigate through ConceptDraw Solution Park, managing downloads and updates. You can access libraries, templates and samples directly from the ConceptDraw STORE.
- If you have any questions, our free of charge support is always ready to come to your aid.
TEN RELATED HOW TO's:
A requisition form is one of the documents used for accounting in different manufacturing processes. There are two main types of requisition: a purchasing requisition and material requisition and difference between them is significant. Creating a flowchart might help you in understanding all the details of accounting process.
Flowcharts are a best visual method for dividing a large and complicated procedure into a several little clear pieces. The main value-ability of an effective flowchart is its simpleness. Material requisition flowcharts are used to document the process of relationships between the different departments and the purchasing department within an organization. The flow chart gives the step-by-step guide on how is carried out the procurement process of the materials necessary for the functioning of the organization. This type of flowchart along with many other business flowcharts, one can easy create using ConceptDraw Flowcharts solution.
Picture: Material Requisition Flowchart. Flowchart Examples
Related Solution:
Stakeholders are the groups of people or organizations whose contribution matters to the organization's success, this can be labour participation, financial participation, dissemination of information about organization, etc. So, the employees of the company, its suppliers, customers, media, public organizations, state authorities, all they are stakeholders of the company.
ConceptDraw DIAGRAM diagramming and vector drawing software extended with Stakeholder Onion Diagrams Solution from the Management Area of ConceptDraw Solution Park is a powerful stakeholder mapping tool which allows easy create Stakeholder Onion diagrams and maps depicting the layers of a project, relationships of stakeholders to a project goal, and relationships between stakeholders.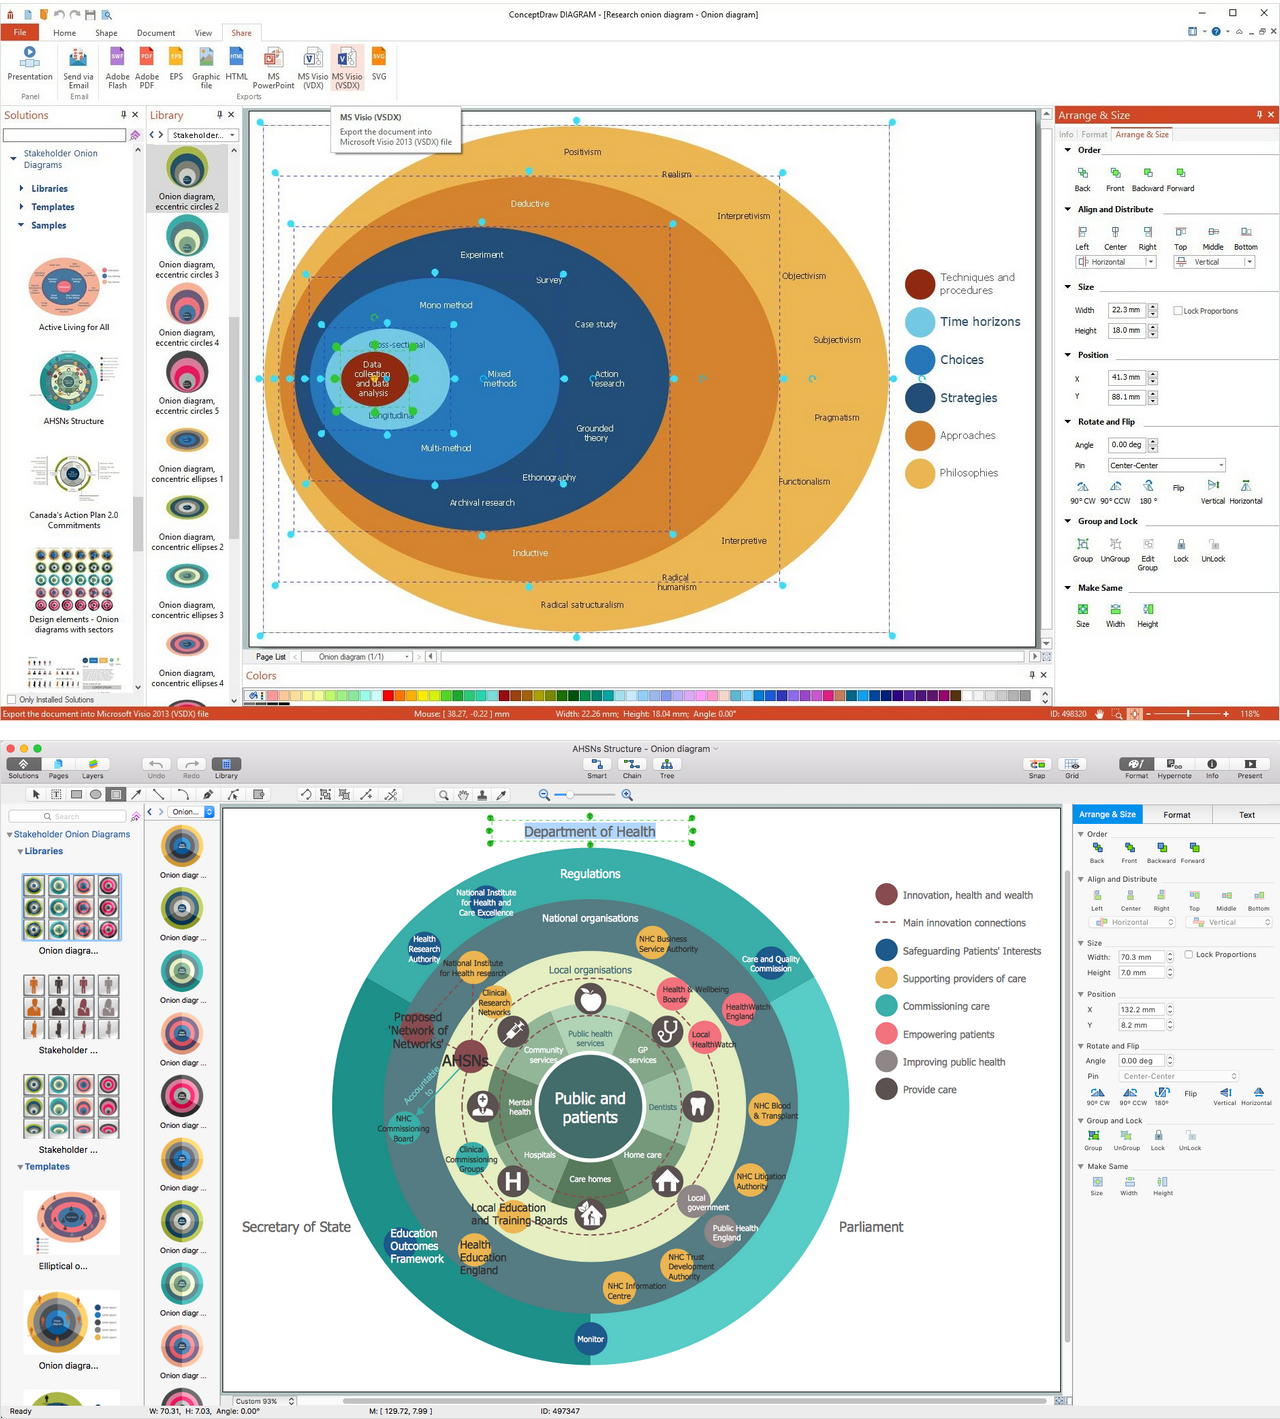
Picture: Onion Diagram as Stakeholder Mapping Tool
Related Solution:
ConceptDraw DIAGRAM is a powerful diagramming and vector drawing software. Extended with Matrices Solution from the Marketing Area of ConceptDraw Solution Park it became the best software for quick and easy designing various types of Matrix Diagrams, including Positioning Map.
Picture: Positioning Map
Related Solution:
ConceptDraw DIAGRAM extended with Matrices Solution from the Marketing Area of ConceptDraw Solution Park is a powerful software for drawing various types of Marketing Matrices: Ansoff Matrix, BCG Matrix, Deployment Chart, Feature Comparison Chart, Competitive Strategies Matrix, Flow Process Chart, Porter's Value Chain Diagram, Positioning Map, and many others.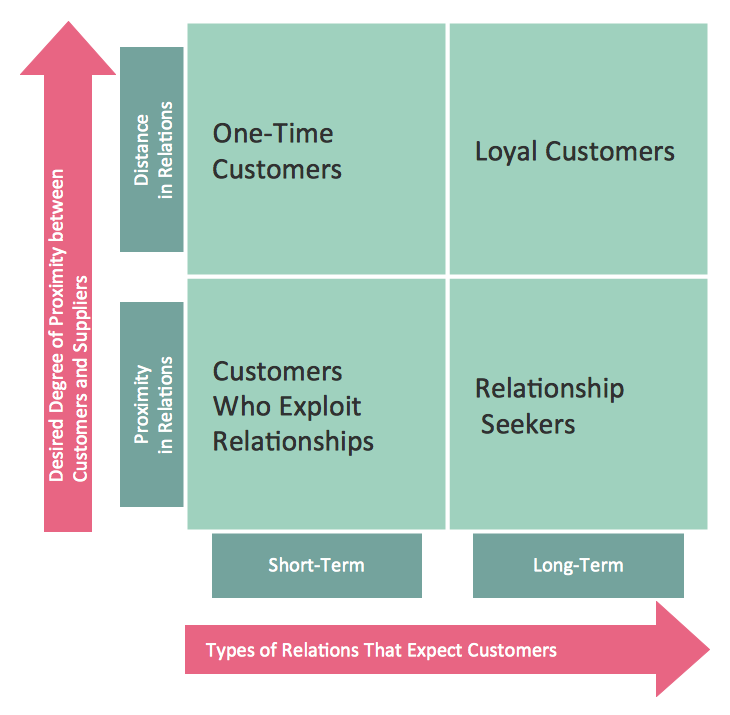
Picture: Matrices
Related Solution:
How to make a Concept Map fast and easy? ConceptDraw DIAGRAM diagramming and vector drawing software extended with Concept Maps Solution from the Diagrams Area is the best choice for those who want design professional looking Concept Map in minutes.
Picture: How To Make a Concept Map
Related Solution:
Everyone wants to be efficient. To succeed, try Mind Maps for Business - SWOT Analysis and enjoy the result. But be careful: it can be addictive!
ConceptDraw products and supported by SWOT and TOWS Matrix Diagrams solution forms a great tool for providing SWOT analysis. The solution contains mind map templates. By filling mind map templates, one can easily determine Strengths, Weaknesses, Opportunities, and Threats of the current business. Just a one click is needed to turn the SWOT mind map into a SWOT matrix. The SWOT diagram will be created in ConceptDraw DIAGRAM on the base of SWOT mind map.
Picture: Mind Maps for Business - SWOT Analysis
Swim lanes are visual elements used in Business Process Maps, Process Flow Diagrams and Flowcharts.
ConceptDraw DIAGRAM diagramming and vector drawing software extended with Business Process Mapping Solution from the Business Processes Area of ConceptDraw Solution Park is ideal for drawing Business Process Maps and Swim Lanes Flowcharts.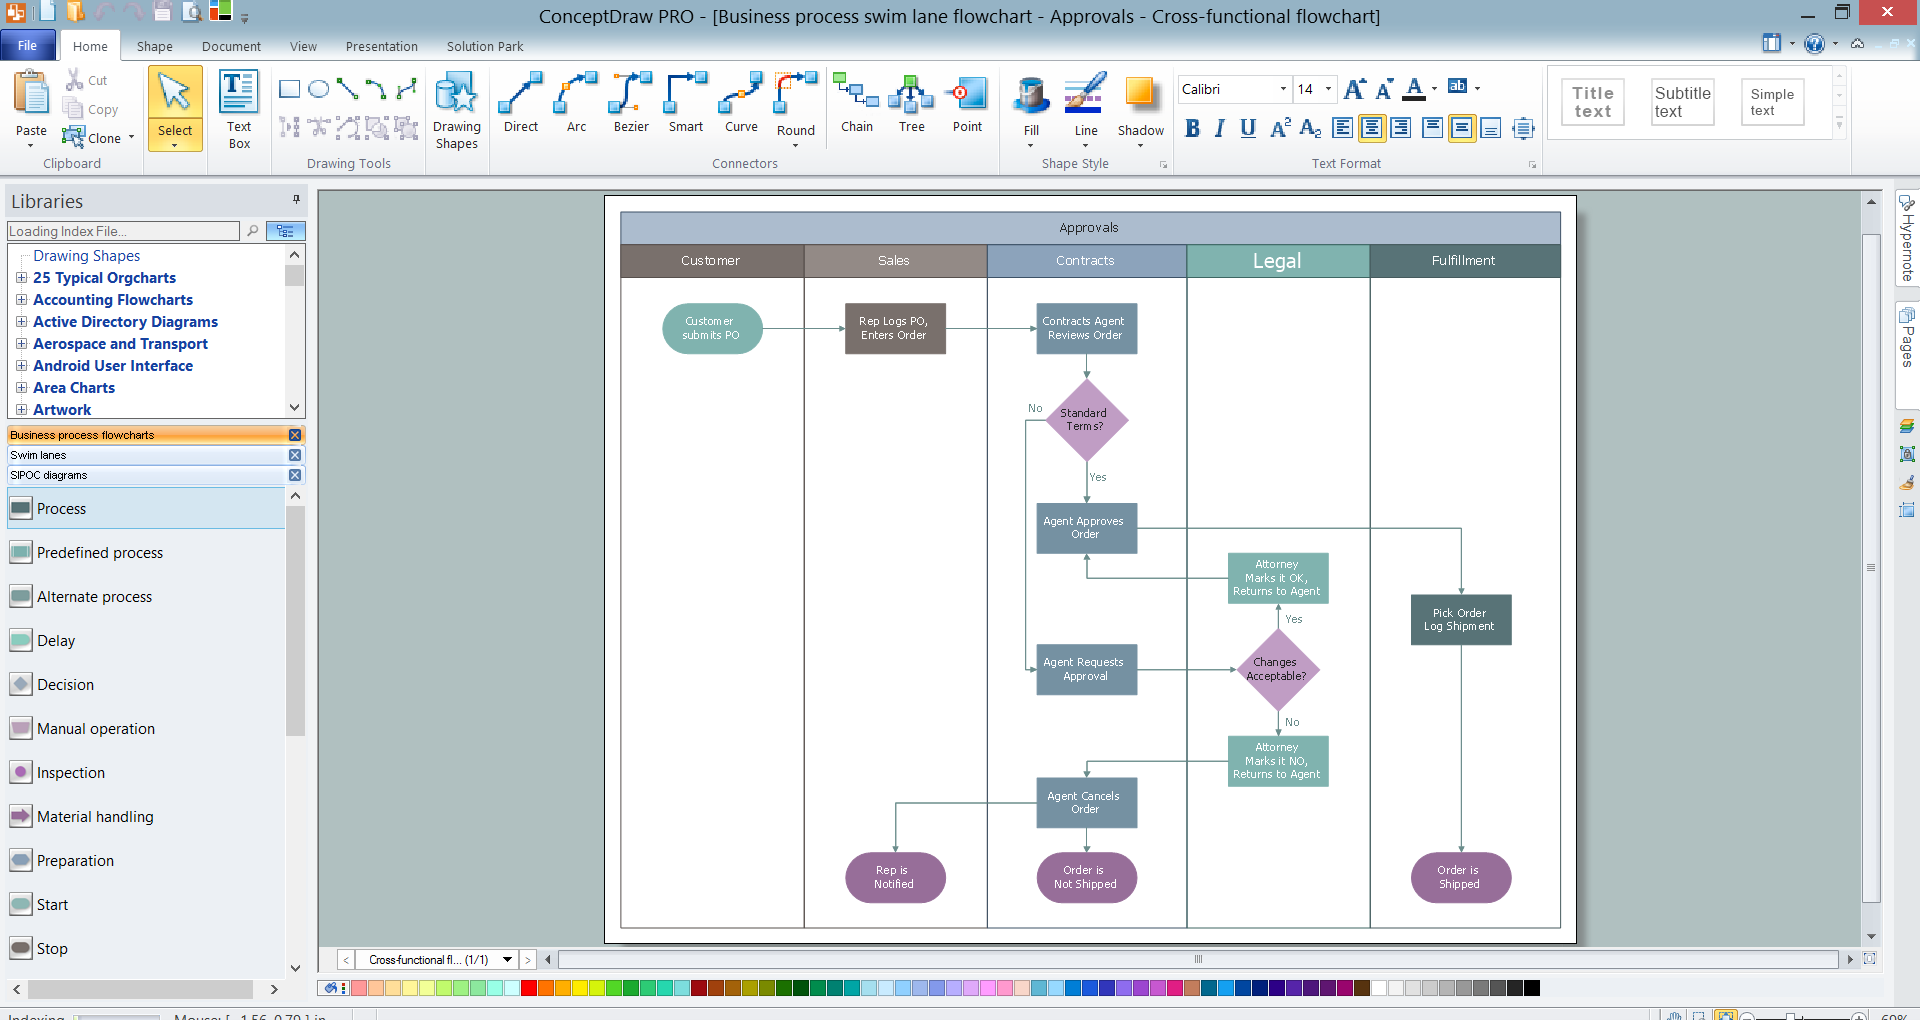
Picture: Swim Lanes
Related Solution:
A flowchart is a simple but very functional tool when it comes to understanding a workflow or to removing unnecessary stages from a process. When drawing flowcharts, keep in mind that there are four common types of flowcharts, like document flowcharts and data flowcharts that show control over a data or document flow over a system. To show controls on a physical level, use system flowcharts. In addition, to show controls in a program, you can draw a program flowchart.
This flowchart diagram represents the piece of an article editing process, that involves the author and editor. It was created using the Basic Flowchart notation that consists from the basic flowchart symbols. The start and the end of the process are indicated with "Terminator" symbols. The "Process" symbols show the action steps consisting from making edits and searching for a compromise, when the author does not agree with the suggestions of the editor. The "Process" symbol is the general symbol in process flowcharts. The "Decision" symbol indicates a branching in the process flow. There are two branches indicated by a Decision shape in the current flowchart (Yes/No, Disagree/Agree). This basic flowchart can be used as a repeating unit in the workflow diagram describing the working process of some editorial office.
Picture: Types of Flowcharts
Related Solution:
An event-driven process chain diagram is a flowchart used in business process analysis. It evolved from Architecture of Integrated Information Systems (ARIS) and utilised in the business process improvement and analysis. It is also used to facilitate enterprise resource planning.
An EPC diagram is a complex flowchart that shows different business processes through various workflows. The workflows are seen as functions and events that are connected by different teams or people, as well as tasks that allow business processes to be executed.
ConceptDraw DIAGRAM is a software for making EPC diagrams that allows managers visually present business process models for making decisions for business.
Picture: How to Draw EPC Diagram Quickly
Related Solution:
You need develop a business model? It’s very easy! All what you need is a powerful Business Process Diagram software. Never before creation of Business Models wasn’t so easy as now with Business Process Diagram Solution for ConceptDraw Solution Park.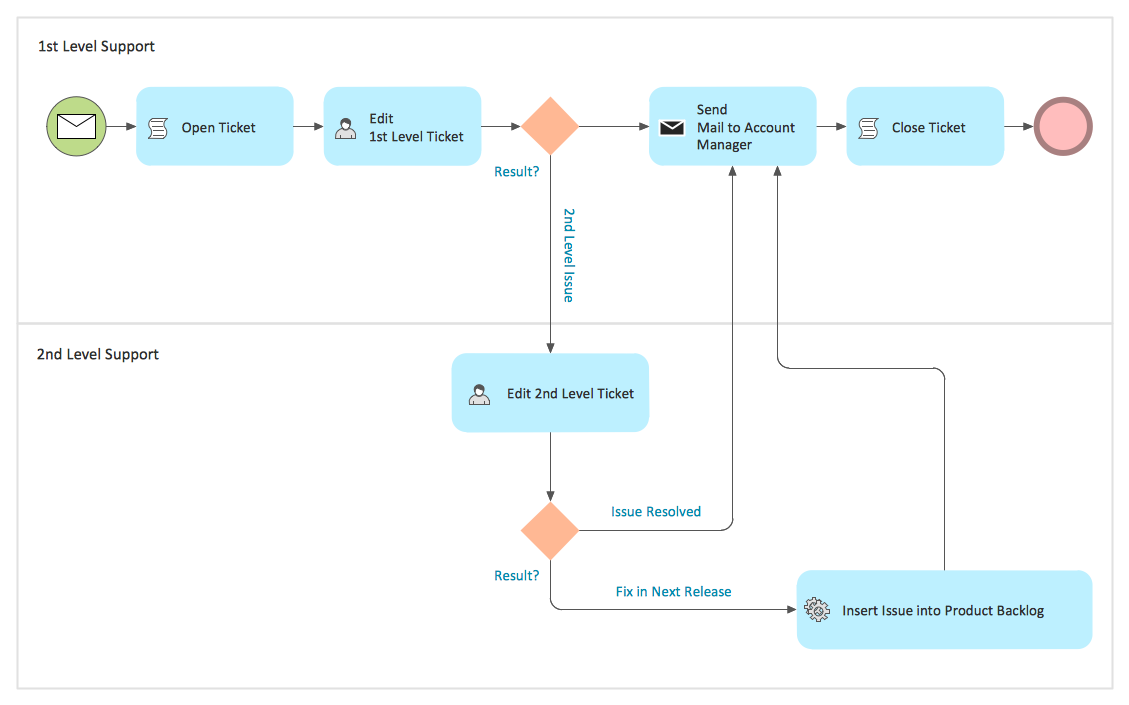
Picture: Business Models
Related Solution:
")


