Process Mapping
To find out what exactly some business entity does, who is responsible for the result, to what standard some business process can be completed so it does not take too much time and resources as well as how the final success of some business process can be determined can be all mentioned within the so called “business process mapping” as all of the mentioned activities are connected to this kind of process.
The main aim of maintaining any business process mapping is to make it possible assist different organizations working in many different fields of business activity to become more effective and so to make more money and to become more successful. To get to the mentioned goal can be possible by having a detailed and clear business process map. Such drawing can be also a diagram, so as long as it allows the outside firms to come in and look at if the improvements are made to the process being implemented right now, then the drawing representing such process may be called to be within the “business process mapping” activity which is known to be taking a specific objective helping to compare and measure it alongside the organization's objectives itself. Those, who are involved in the implementing the “business process mapping”, have to make sure that all of the processes within some particular organisation are aligned with this organisation’s values as well as its capabilities.
The first similar to “business process mapping” structured method for documenting the process flows was developed by Frank Gilbreth in 1921. It was the “flow process chart” created within the presentation called the “Process Charts—First Steps in Finding the One Best Way”. All the tools Gilbreth used were integrated into industrial engineering curricula and already in 1930 an industrial engineer began to train different people, occupied in different fields of business activity. His name was Allan H. Mogensen and he used the mentioned tools of the industrial engineering at his Work Simplification Conferences in New York and already in 1944 there were first graduates of the Mogensen's class, including Art Spinanger who took the tools back to “Procter and Gamble” company where he developed their so called “work simplification program” called the “Deliberate Methods Change Program” and Ben S. Graham who became a Director of the company called “Formcraft Engineering at Standard Register Industrial”. The last mentioned graduate adapted the flow process chart to the “information processing” by developing the so called “multi-flow process chart” for displaying many different documents as well as the relationships among them.
Thus, “process charts” and “business process mapping” can be used as synonyms. They became much more popular after the mentioned events because of the simplicity the provide for making it easier to understand the business world for those who are interested in beginning a new career in one of the existing fields of the business activity. All process maps as well as process charts can nowadays be simply used in any section of business and life activities in general.
The main steps within the process of improvement within the process mapping are, first of all, the processes of the identification, including identifying scope, objectives, work and players’ areas. It is also very important to gather the needed information such as process facts of what, where, when and who is involved in such processes. Such information can be taken from the people who do the work within the company which activity is being analysed. Once the first two steps are done, the it is possible to actually start the Process of Mapping itself be converting the given facts into a process map creating the process charts in this way. Next step is analysis which assumes the work through the already created map, challenging each step with such questions as “what-why?”, “where-why?”, “when-why?”, “who-why?” and “how-why?”. After, there’s a need of developing the existing or installing the new methods if needed. All work at this step involves eliminating the unnecessary work, combining the existing steps, re-arrange them and add, if needed, the new one where it is necessary.
The final step would be managing the process itself by maintaining the recently created process map in library, reviewing the routinely and monitoring the whole process for making the changes in it, if needed, in order to achieve such business goals, as the business process improvement, arranging training for its staff, clarifying the process as well as the workflows within some organisation, conducting the internal audit within the company, clarifying the roles of each of the workers and following the Regulatory rules for achieving the compliance.
Process mapping very well known to be capable to support different developments, overlapping with the needed software development incorporating tools by attaching metadata to activities, triggers and drivers for providing at least some automation of the software process coding.
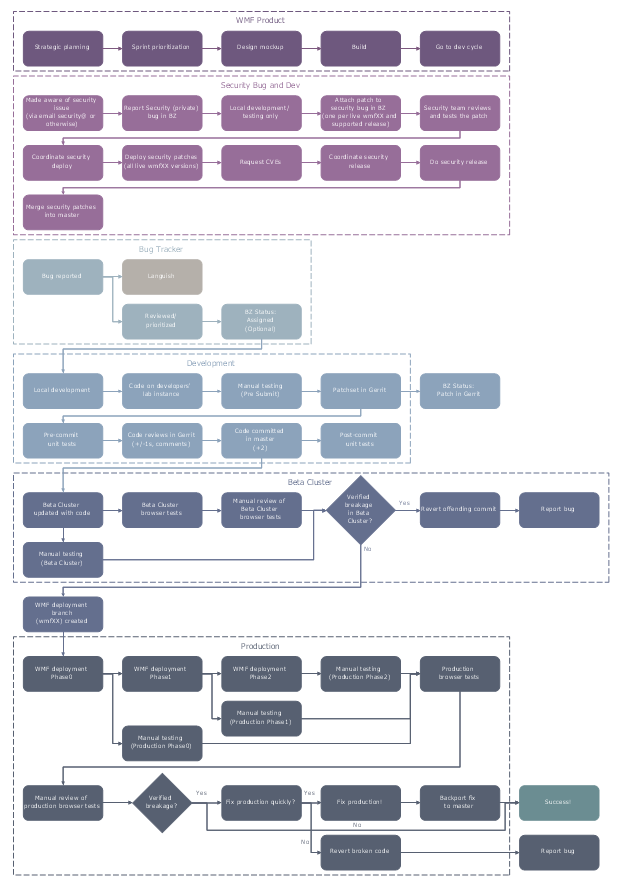
Example 1. Process Mapping — Wikimedia Development and Deployment Flowchart
Usually Business Process Mapping is a quite complex process which requires a lot of time, efforts and design skills. But now you have an excellent possibility to concentrate on your work, not on the design process thanks to wide variety of predesigned vector objects grouped in 3 libraries and included in Business Process Mapping Solution.


All these objects are vector, so you can resize them without loss of quality, change their color to make your maps, diagrams and flowcharts more interesting, bright and attractive.

Example 2. Process Mapping — Proposed Patient Appointment Procedure
If you work in the software engineering company or simply deal with such kinds of analysis mentioned in this article, then you might face a need of creating a smart process chart to use for illustrating the results of the analysis on. Making such chart may be useful to have ConceptDraw DIAGRAM diagramming and drawing software. This product of CS Odessa extended with solutions from ConceptDraw STORE (which also can be always downloaded from this site) is the one simplifying its users works with making such drawings as process mapping, as well as many other schematics.

Example 3. Process Mapping - Distribution Flowchart
The samples you see on this page were created in ConceptDraw DIAGRAM process mapping software using the Business Process Mapping Solution for ConceptDraw Solution Park. An experienced user spent 10-15 minutes creating each of these samples.
In each of the solution of the new product of CS Odessa — ConceptDraw STORE — you can always find the pre-made examples of the most commonly used drawings to have them as your drafts for editing and so getting your own smart and simply great looking diagrams, charts, flowcharts, maps, plans and many other schemes.


