This example of a VSM diagram was drawn using ConceptDraw DIAGRAM with the Value Stream Mapping solution from ConceptDraw Solution Park.
This sample Value Stream Map shows how customer value is created in the steps of manufacturing, production control, and shipping processes.
TEN RELATED HOW TO's:
You want to decorate menu, design pictorial illustration for the cooking article in the fashionable magazine, create attractive posters for your cafe or restaurant, or develop beautiful advertising materials? In order to ideally cope with all these tasks, use the easy recipes design software - ConceptDraw DIAGRAM extended with Cooking Recipes solution from the Food and Beverage area of ConceptDraw Solution Park.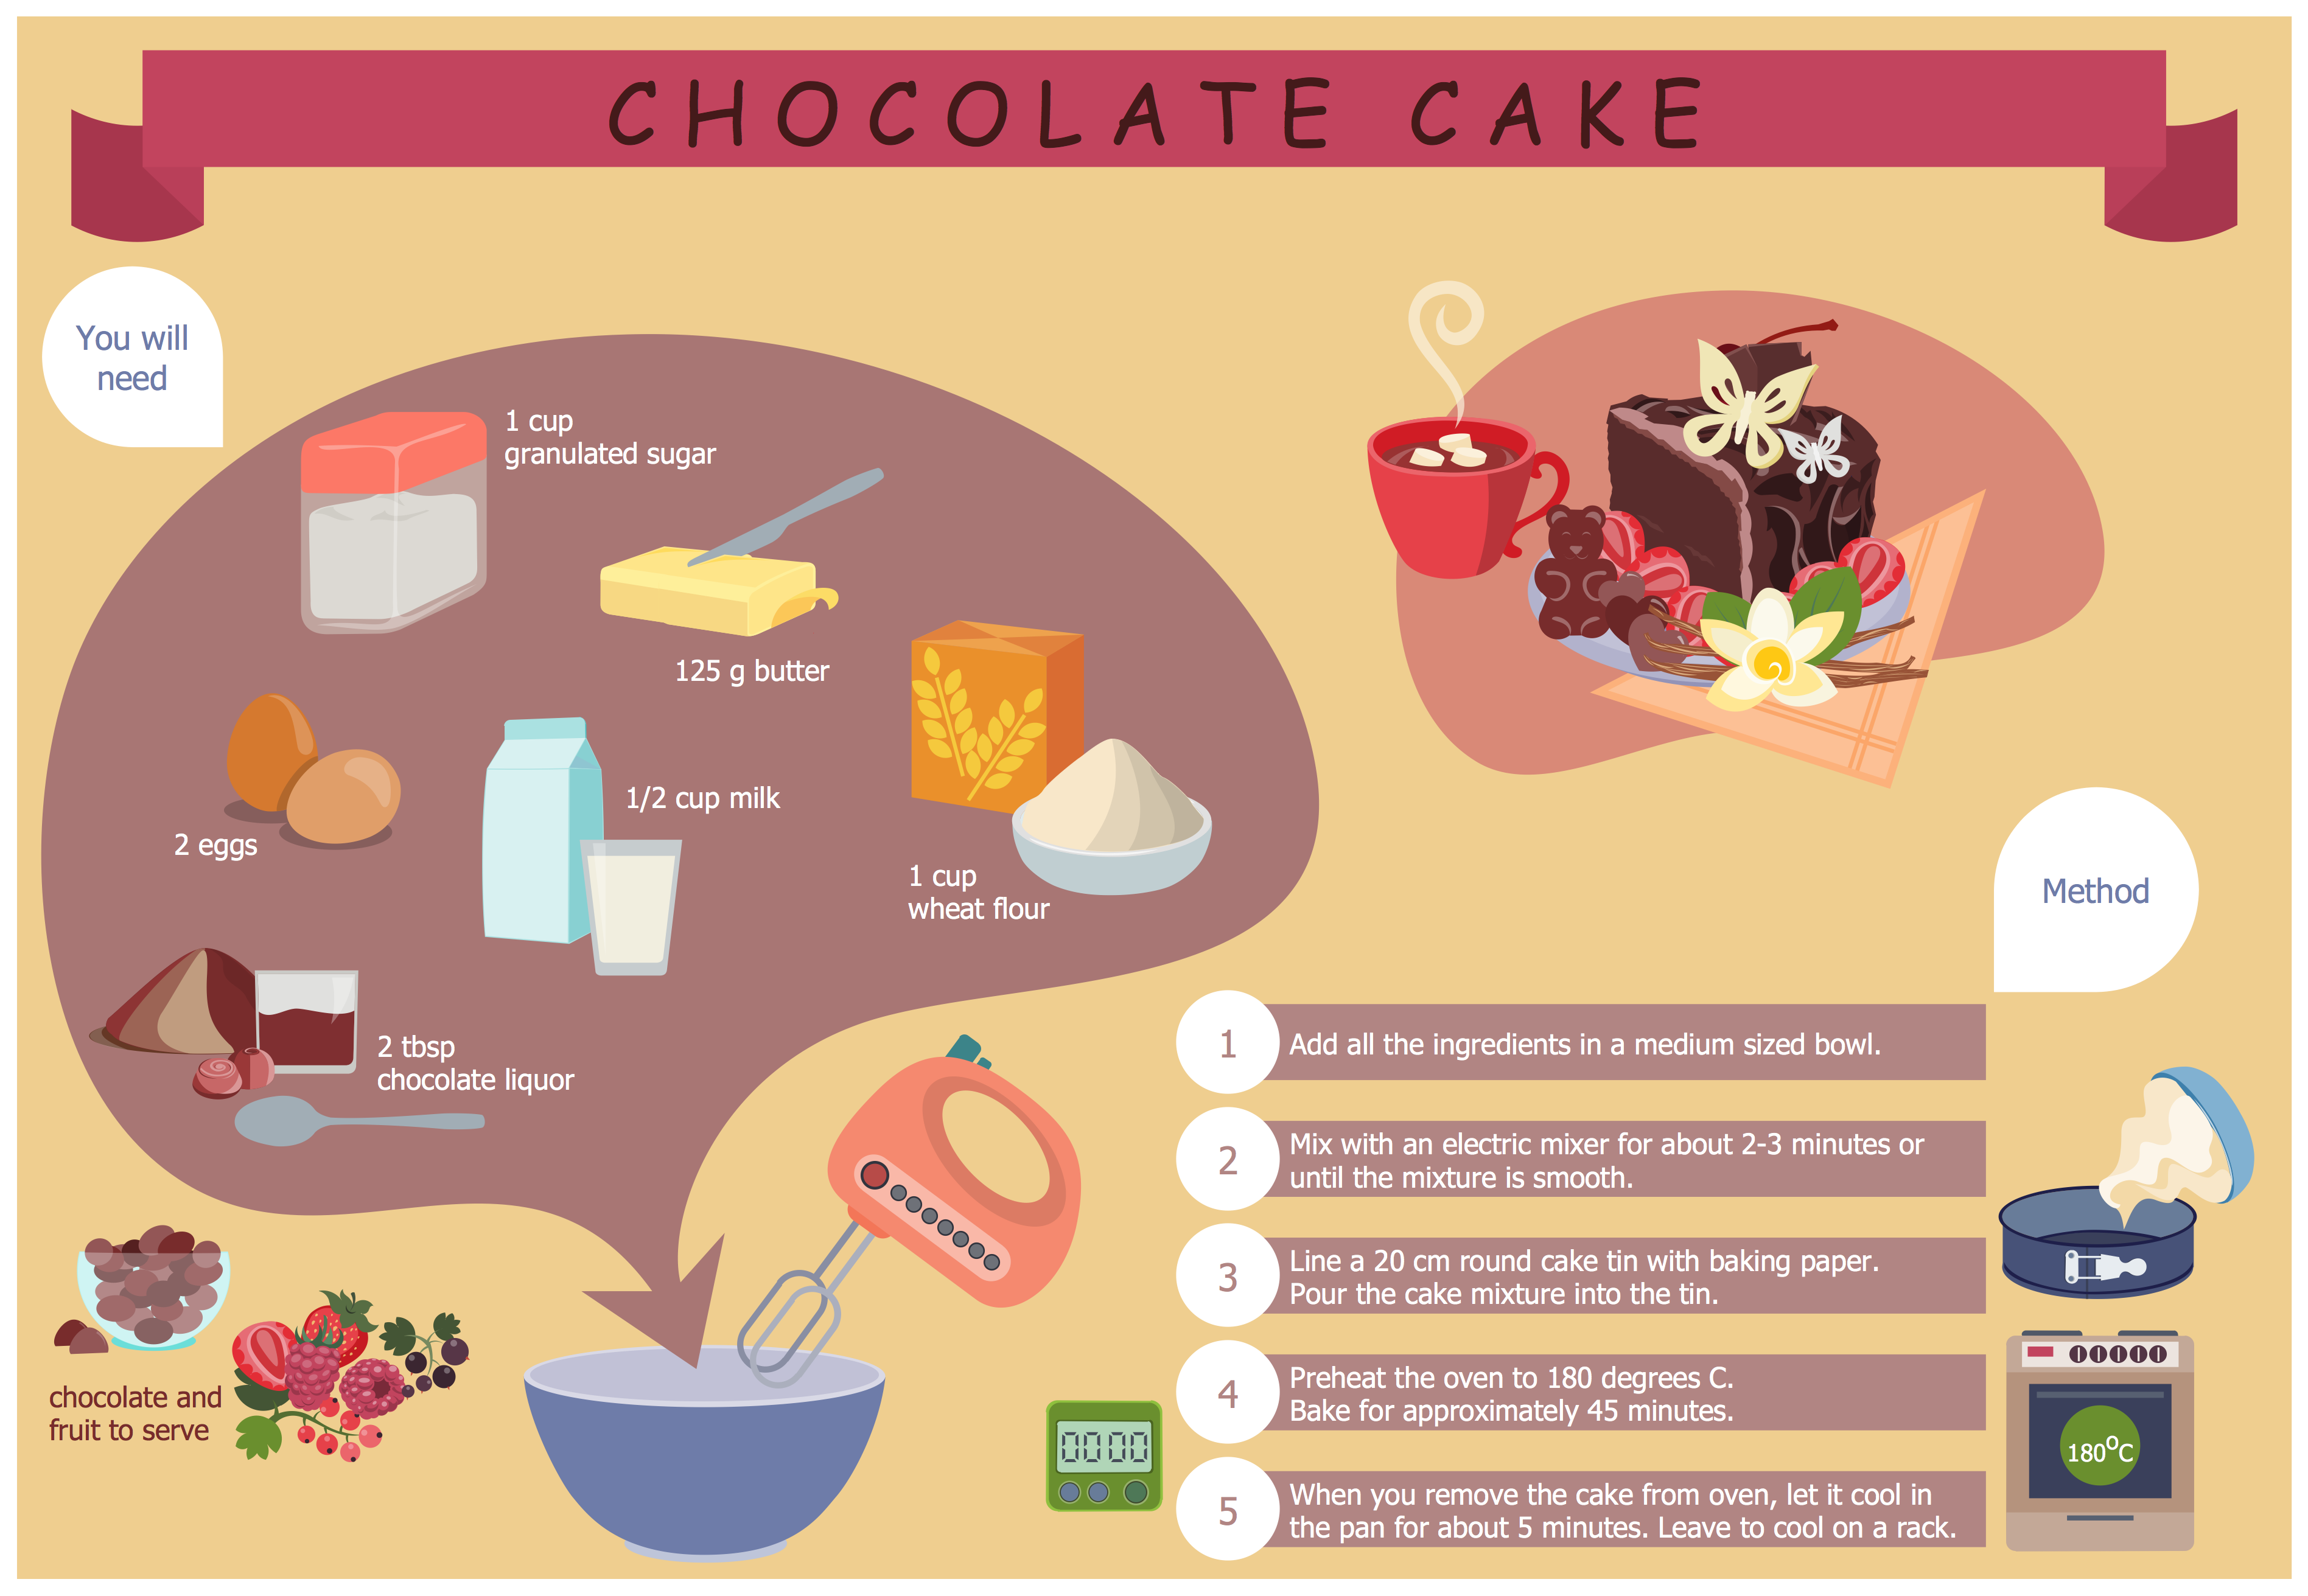
Picture: Easy Recipes
Related Solution:
It's very simple, convenient and quick to design professional looking Flowcharts of any complexity using the ConceptDraw DIAGRAM diagramming and vector drawing software extended with Flowcharts Solution from the Diagrams Area of ConceptDraw Solution Park which provides a wide set of predesigned objects, templates, samples and Flowchart examples.
Picture: Flowchart Examples
Related Solution:
Total quality management is the one known to be consisting of some organization-wide efforts put in order to install and to make some climate in which this organization can continuously improve its ability to deliver the high-quality products and services to its customers permanently.
Picture: Total Quality Management Definition
Related Solution:
This sample represents the actors, use cases and dependencies between them, and also the relationships between use cases. There are used dependency and use case generalization associations on this UML diagram. Use case generalization is used when you have two similar use cases, but one of them does more than another.
This sample shows the work of the Financial Trade sphere and can be used by trading companies, commercial organizations, traders, different exchanges.
Picture: Financial Trade UML Use Case Diagram Example
Value Stream Maps are used in lean methodology for analysis of manufacturing process and identification of the improvement opportunities.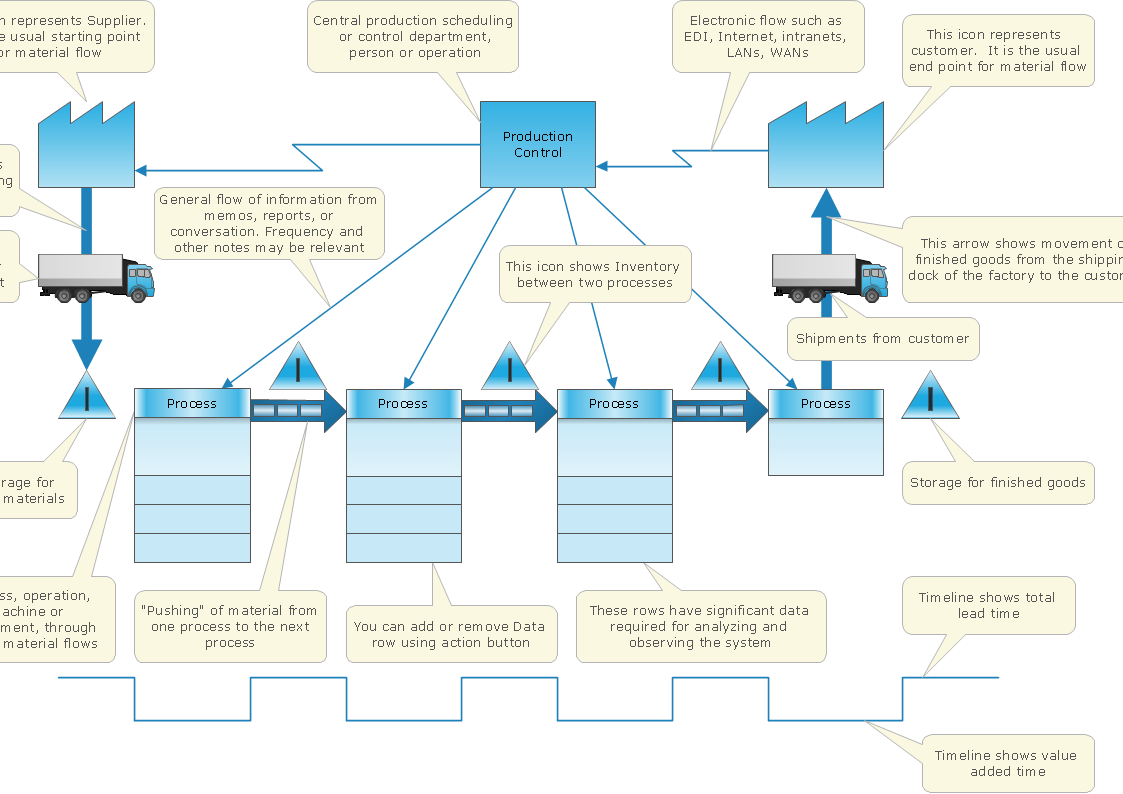
Picture: Value Stream Mapping and Analysis
Related Solution:
ConceptDraw DIAGRAM is perfect for software designers and software developers who need to draw Rack Diagrams..png)
Picture: Design Element: Rack Diagramfor Network Diagrams
ConceptDraw DIAGRAM diagramming and vector drawing software extended with Flowcharts Solution from the 'Diagrams' area of ConceptDraw Solution Park is a powerful tool for drawing Flow Charts of any complexity you need. Irrespective of whether you want to draw a Simple Flow Chart or large complex Flow Diagram, you estimate to do it without efforts thanks to the extensive drawing tools of Flowcharts solution, there are professional flowchart symbols and basic flowchart symbols. This sample shows the Gravitational Search Algorithm (GSA) that is the optimization algorithm.
Picture: Simple Flow Chart
Related Solution:
ConceptDraw DIAGRAM is a world-class diagramming platform that lets you display, communicate, and present dynamically. It′s powerful enough to draw everything from basic flowcharts to complex engineering schematics.
Video tutorials on ConceptDraw products. Try it today!
Picture: Business Process Mapping — How to Map a Work Process
Related Solutions:
You can use SWOT analysis PowerPoint presentation to represent strengths, weakness, opportunities, and threats involved in your SWOT matrix.
Picture: How to Create a PowerPoint Presentation from a SWOT Analysis Mindmap
Related Solution:
The Total Quality Management Diagram solution helps you and your organization visualize business and industrial processes. Create Total Quality Management diagrams for business process with ConceptDraw software.
Picture: TQM Diagram Tool
Related Solution:
