How to Create Gantt Chart
|
To begin managing a new project, you will need to define the individual Tasks that must be completed to deliver it. The default view for a new project in is the Gantt Chart. The left pane of a Gantt chart displays a list of project Tasks. The right pane displays a calendar and timeline of those tasks. |

Pic. 1. ConceptDraw PROJECT - Gantt chart view.
- The first step in planning a new project is to create a list of the different tasks and phases in your project. There are several ways to add tasks to your Gantt Chart. The simplest way it to press the Add button
 on the toolbar. You can also press the Enter key on your keyboard.
 - The Gantt Chart table has columns for all of your project data, like task name, start and finish dates, duration, and completion level. Name the Task, and assign its duration. You can do so by double-clicking on the fields in the left pane of the Gantt chart, and then typing on your keyboard. Or simply drag and drop your tasks in the right pane of the Gantt chart to where you want them.
- You can also easily change a task’s start and finish dates. Either manually enter the data into the table, or drag the edge of the task to lengthen or shrink it in the graphical timeline view.
- Group Tasks into Phases. Use the Indent button
 create project phases on the Home toolbar to subordinate a Task, thereby making the dominant item into a Phase.
 - To establish a relationship between Tasks, select two or more Tasks on the Gantt chart, and then click the Link button
 to link project tasks on the toolbar.
 - The Gantt Chart also allows you to indicate a task’s priority level. Task colors can be used to highlight your tasks to draw attention to certain sections of your project.
You can also learn how to further manage the project task list.
TEN RELATED HOW TO's:
Working with information can be quite tedious, furthermore, some data can be quite difficult to perceive without any graphic representation. So, to facilitate your work, you can use business diagrams, such as simple flowcharts or Gantt charts for project management and orgcharts for clarifying your company structure. You can use a proper software, like ConceptDraw Pro, draw them on paper, or use whiteboards, but it is more convenient to use a digital tool.
This diagram shows a cross-functional flowchart that was made fore telecom service provider. A workflow of a common telecommunication service provider has a rather branched structure. Thus, it is useful to have a flow chart to visualize the sequences and interrelations of the work flow steps. Business process flowchart contains 17 processes and 4 decision points,that are distributed through 2 lines depicting the participants involved. Also there are connectors that show the data flow within processes. This flowchart displays a detailed model of the telecom service trading process, as well as all participants in the process and how they interact with each other.
Picture: Business diagrams & Org Charts with ConceptDraw DIAGRAM
ConceptDraw PROJECT is simple project scheduling software delivering the full range of classic project reports about statuses and resorces usage. Learn how features of project gantt charts works in simple ConceptDraw PROJECT scheduling software, how to export project management dashboard in excel representation.
Picture: Gantt charts for planning and scheduling projects
The Gantt Chart is the main interface in ConceptDraw PROJECT. It summarizes the tasks in your project and presents them graphically so you can easily view your progress.
Picture: Gantt Chart Software
ConceptDraw DIAGRAM extended with Typography Infographics Solution from the “Infographics” Area is the best Infographic Generator. Make sure in it right now!
Typography Infographics Solution offers you the best numerous collection of predesigned infographics examples and 9 libraries with large quantity of ready-to-use vector stencils that will help you design your own Typography Infographics of any complexity in minutes..
Picture: Infographic Generator
Related Solution:
It is convenient to represent various routes, directions, roads on the directional maps and navigation schemes. ConceptDraw DIAGRAM diagramming and vector drawing software supplied with Directional Maps Solution from the Maps Area of ConceptDraw Solution Park is effective for drawing Directions Maps.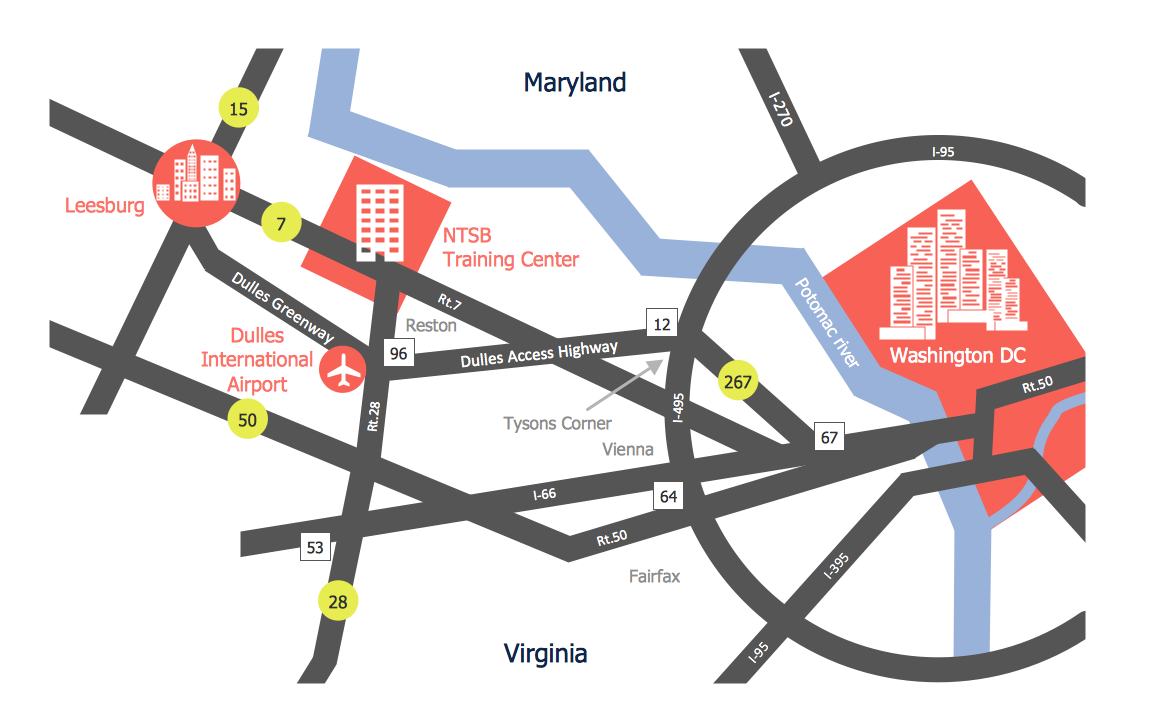
Picture: Directions Maps
Related Solution:
It doesn’t matter what kind of business you have, a bar or a gym, there are common concepts for any of them. One of those concepts is accounting, and to facilitate the work with the figures, you can use accounting flowchart symbols and create a clear and representative scheme. You can create flowchart for auditing, tax accounting and even for planning your own budget.
A graphical tool for displaying successive processes is flowchart. This method is mostly suited to represent an accounting process. The sequence of steps in the accounting process usually consists of standard accounting procedures, that can be depicted by using a minimal number of symbols, applied for the basic flowcharting. The advanced opportunity to create professional Accounting Flow charts is provided by ConceptDraw Accounting Flowcharts solution. It includes contains a library of accounting flowchart symbols used when drawing the accounting process flow.
Picture: Accounting Flowchart Symbols
Related Solution:
Explore practical flowchart examples including business process diagrams, workflow charts, swimlane flowcharts, and IT troubleshooting flows. Review common patterns and start from ready templates.
Picture: Flowchart Examples
Related Solution:
The Microsoft Windows Azure platform is a highly flexible cloud-based solution with variety of services which supports not only the execution of.NET applications, but also allows developers to use programming languages like Java, PHP, Node.js, or Python.
ConceptDraw DIAGRAM diagramming and vector drawing software provides the Azure Architecture Solution from the Computer and Networks area of ConceptDraw Solution Park with a lot of useful tools which make easier: illustration of Windows Azure possibilities and features, describing Windows Azure Architecture, drawing Azure Architecture Diagrams, depicting Azure Cloud System Architecture, describing Azure management, Azure storage, documenting Azure services.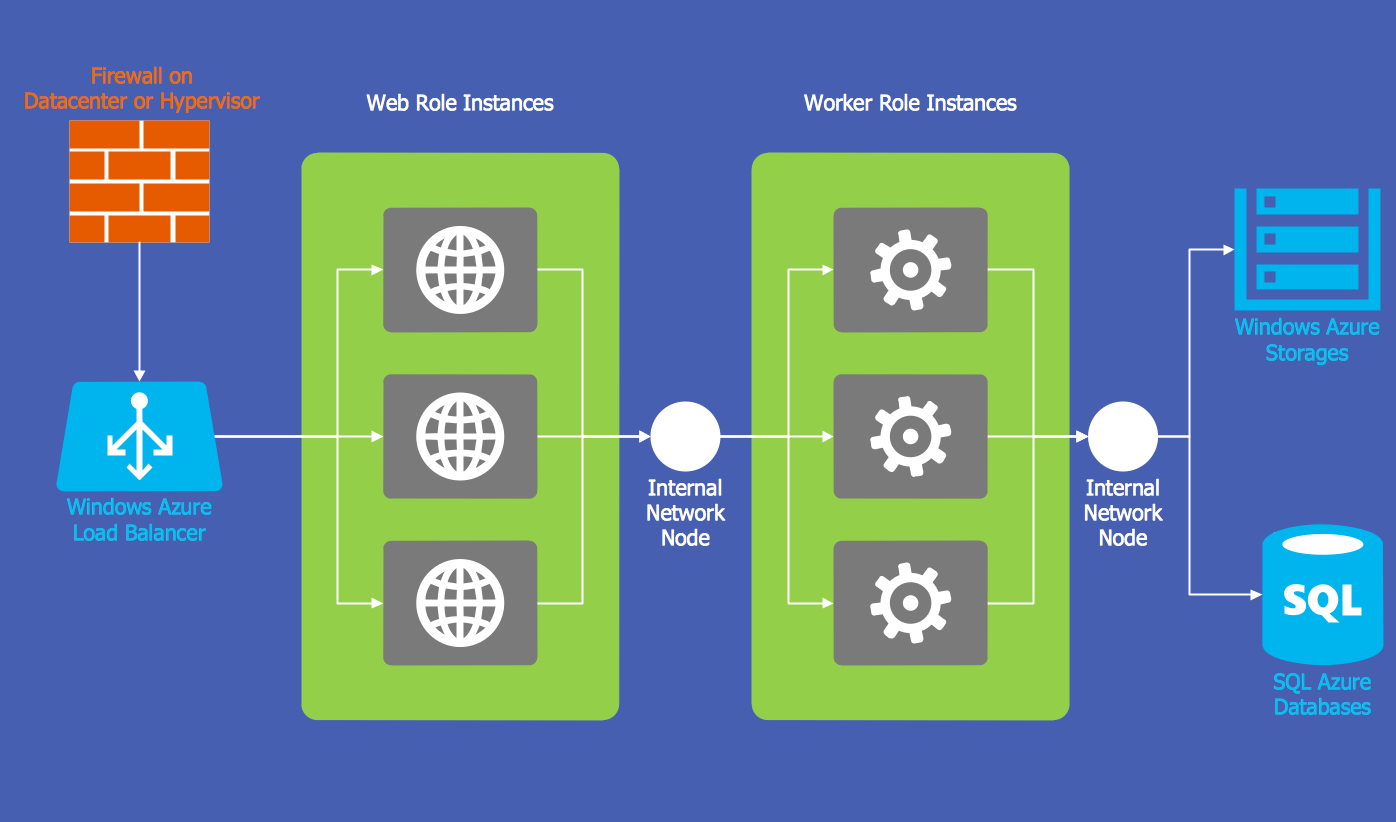
Picture: Windows Azure
Related Solution:
Describing a workflow or approval process can take hours and be too complicated, especially since there are options to do it quickly and vividly. Diagrams called flowcharts replace long paragraphs of boring text and represent information in a graphic way. You can draw one on paper or you can use flowchart software to do it quickly and scalable. This kind of software is easy to use and you don’t need any special skills to start using it. In addition, there are a lot examples and predesigned templates on the Internet.
Flowcharts are a best tool for staking out a huge and complex process into some small readable parts. Surely, flowcharts can be drawn manually but the use of standard symbols that make it clear for a wide audience makes a software tool preferred for this task. The core for a successful flowchart is its simplicity. That is why often before beginning making flowchart through software, people draw the sketch on a piece of paper. Designing an effective flowchart means the combination of the data needed to be shown and the simplicity with which you depict it.
Picture: Flowchart Software: A Comprehensive Guide
Related Solution:
ConceptDraw DIAGRAM is a Wireless Network Drawing Mac OS software.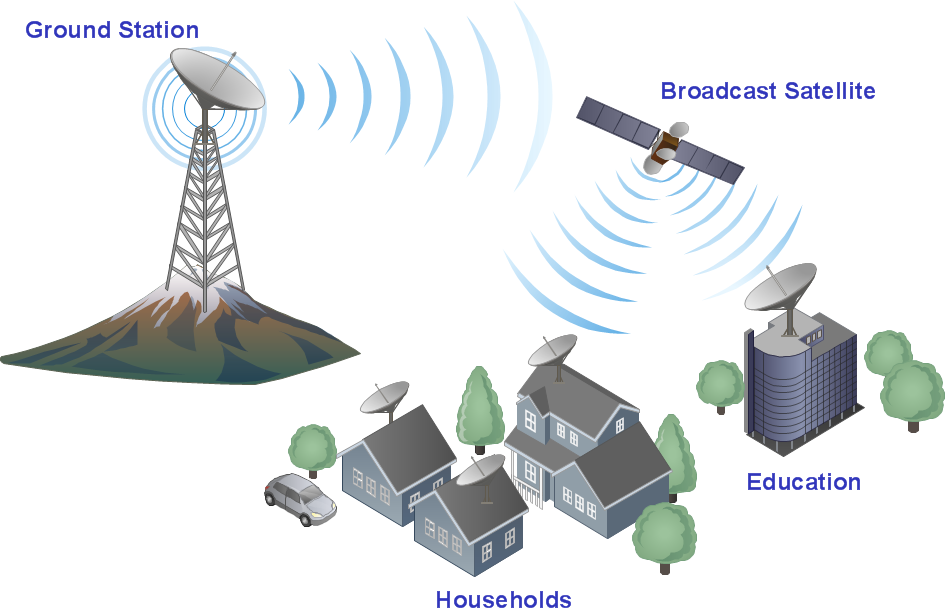
Picture: Wireless Networking for Mac
Related Solution:
ConceptDraw
PROJECT 15