Made with
ConceptDraw
DIAGRAM 18

Timeline Diagrams

Timeline is a powerful tool for project management and project scheduling, it is a convenient way to represent a chronological sequence of events and critical milestones along a time axis. Timeline allows quickly understand the temporal relationships and to see the progress of a project schedule.

ConceptDraw DIAGRAM extended with Timeline Diagrams solution from the Management area of ConceptDraw Solution Park is a powerful software for fast and easy drawing useful and great-looking timeline diagrams.

Timeline Diagrams

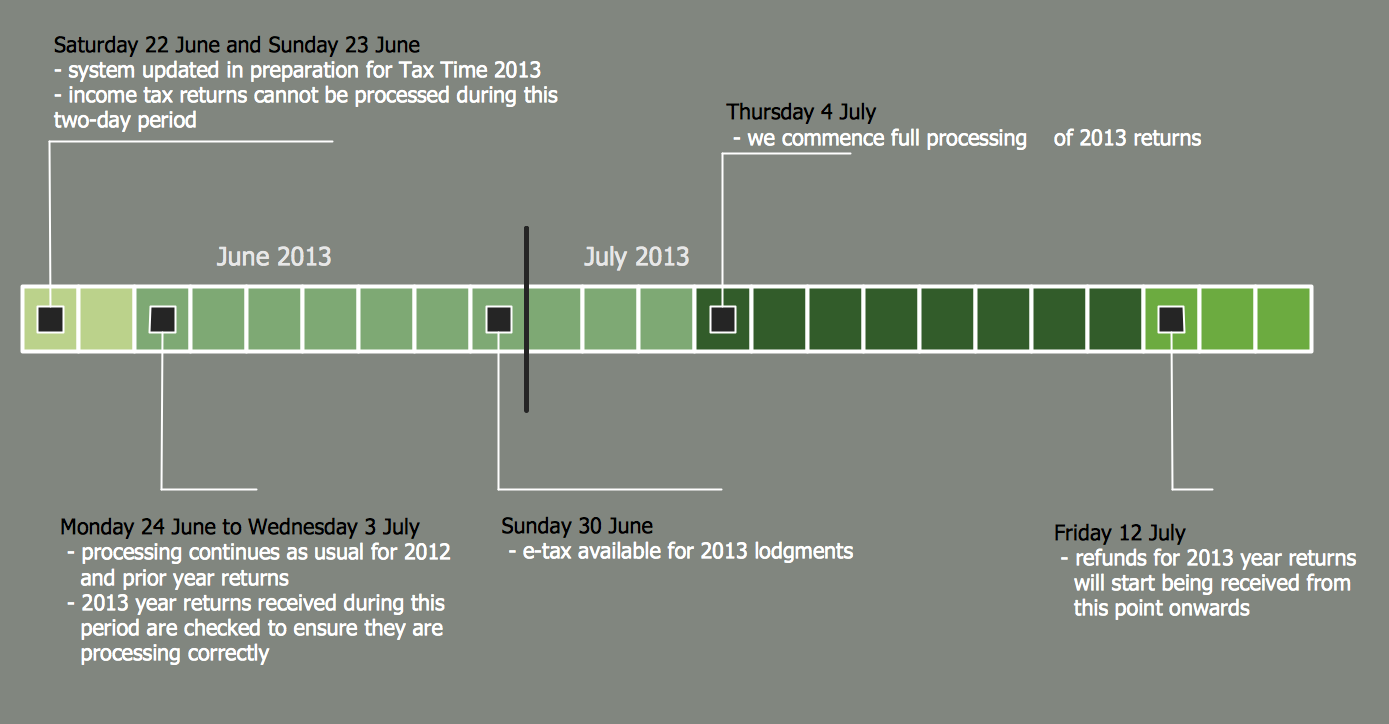
Example 1. Timeline Diagram — Tax Time 2013 System Availability and Processing Timeline

Timeline Diagrams Solution provides a wide set of various templates and samples which are available from ConceptDraw STORE, and also Timelines and Milestones library with variety of predesigned vector objects.

Timeline Diagram - Smart America Challenge

Example 2. Timeline Diagram — Smart America Challenge

All samples are professional looking and attractive. You can successfully use them as the base for drawing your own timeline diagrams in minutes.

Timeline Diagram - Request for Proposal Plan

Example 3. Timeline Diagram — Request for Proposal Plan

The timeline diagrams you see on this page were created in ConceptDraw DIAGRAM software using the Timeline Diagrams Solution for ConceptDraw Solution Park. These samples successfully demonstrate solution's capabilities and professional results you can achieve. An experienced user spent 10 minutes creating each of these examples.

Use the Timeline Diagrams Solution to create your own timeline diagrams of any complexity fast and easy, and then successfully use them.

Use Solution:

  • Design Timeline Diagram
  • Illustrate Events
  • Represent Time Periods on a Chronological Scale
  • Visualize Project Milestones and Project Progress
  • Timeline Diagrams Samples, Templates and Examples
  • Design Elements for Timeline Diagrams Creating

All source documents are vector graphic documents. They are available for reviewing, modifying, or converting to a variety of formats (PDF file, MS PowerPoint, MS Visio, and many other graphic formats) from the ConceptDraw STORE. The Timeline Diagrams Solution is available for all ConceptDraw DIAGRAM or later users.


SEVEN RELATED HOW TO's:
Learn what a workflow diagram is, how it differs from a flowchart, and how to create one step by step. Includes real examples, structural elements, KPIs, and best practices for clearer execution and process improvement.Emergency assessment workflow with coordinated response stages
Picture: WorkFlow Diagram
Related Solution:
When we start to speak about databases, we must always mention database structure visualization. One of the most common ways to do it is to create an entity relationship diagram, and to put appropriate symbols on it. It is important either for database projecting and for its' future maintenance. Entity Relationship Diagram describes data elements and their relationships within a database. There are a set of special symbols that depict each element of an entity relationship diagram. Entities - represents some stable components such as supplier, employee, invoice, client, etc. Relation symbols show how the entities interact. Attributes define characteristics of the relationships. Attributes can be one-to-one or many-to-many. Physical symbols is used in the physical models. They represent items such as fields, tables, types and keys. ERD physical symbols are the building material for the database. Notation lines are used to illustrate the relationships. The most common method is Crow’s Feet notation. You can use ConceptDraw Entity-Relationship Diagram (ERD) solution to represent a database using the Entity-Relationship model.Entity Relationship Diagram Symbols
Picture: Entity Relationship Diagram Symbols
Related Solution:
A software tool that saves your time on making decisions now has the ability to make decisions with remote team via Skype.Decision Making Software For Small Business *
Picture: Decision Making Software For Small Business
Related Solution:
Describing a workflow or approval process can take hours and be too complicated, especially since there are options to do it quickly and vividly. Diagrams called flowcharts replace long paragraphs of boring text and represent information in a graphic way. You can draw one on paper or you can use flowchart software to do it quickly and scalable. This kind of software is easy to use and you don’t need any special skills to start using it. In addition, there are a lot examples and predesigned templates on the Internet. Flowcharts are a best tool for staking out a huge and complex process into some small readable parts. Surely, flowcharts can be drawn manually but the use of standard symbols that make it clear for a wide audience makes a software tool preferred for this task. The core for a successful flowchart is its simplicity. That is why often before beginning making flowchart through software, people draw the sketch on a piece of paper. Designing an effective flowchart means the combination of the data needed to be shown and the simplicity with which you depict it.Flowchart Software
Picture: Flowchart Software: A Comprehensive Guide
Related Solution:
Working with information can be quite tedious, furthermore, some data can be quite difficult to perceive without any graphic representation. So, to facilitate your work, you can use business diagrams, such as simple flowcharts or Gantt charts for project management and orgcharts for clarifying your company structure. You can use a proper software, like ConceptDraw Pro, draw them on paper, or use whiteboards, but it is more convenient to use a digital tool. This diagram shows a cross-functional flowchart that was made fore telecom service provider. A workflow of a common telecommunication service provider has a rather branched structure. Thus, it is useful to have a flow chart to visualize the sequences and interrelations of the work flow steps. Business process flowchart contains 17 processes and 4 decision points,that are distributed through 2 lines depicting the participants involved. Also there are connectors that show the data flow within processes. This flowchart displays a detailed model of the telecom service trading process, as well as all participants in the process and how they interact with each other.Business diagrams & Org Charts with ConceptDraw DIAGRAM  *
Picture: Business diagrams & Org Charts with ConceptDraw DIAGRAM
Value Stream Map template helps you to create VSM diagrams using ConceptDraw DIAGRAM software.How To create Value Stream Map (VSM) *
Picture: How To create Value Stream Map (VSM)
Related Solution:
ConceptDraw DIAGRAM is a flowchart creating software. This software includes over 20 vector stencils in libraries. These objects allow you to create well-designed flowcharts. Put an initial object from library to a page and use RapidDraw technology clicking on direction arrows to add new objects to the flowchart. This way you can make flowchart quickly.How To Create a Flow Chart in ConceptDraw *
Picture: How To Create a Flow Chart in ConceptDraw
Related Solution:
ConceptDraw
DIAGRAM 18