
Pic.1 Event-driven Process Chain (EPC) flowchart - business process modelling
Stencil library EPC Diagram shapes, symbols from Event-driven Process Chain Diagrams solution provides 23 vector design elements for drawing event-driven process chain diagrams.
 flowchart symbols")
Pic.2 Event-driven Process Chain (EPC) flowchart symbols and template for drawing business process
Use design elements from the EPC Diagram Shapes library for drawing your EPC flowcharts to plan resources and improve business processes.
TEN RELATED HOW TO's:
The ConceptDraw DIAGRAM is a best flow chart tool for the job. The samples and templates included in the basic set allows users to draw any type of a flowchart. The vector stencils created by designers give ability to draw great-looking flowchart. Flowcharts give to users the ability to represent structural data visually.
Picture: Use the Best FlowChart Tool for the Job
Related Solution:
The Total Quality Management Diagram solution helps you and your organization visualize business and industrial processes. Create Total Quality Management diagrams for business process with ConceptDraw software.
Picture: Total Quality Management Value
Related Solution:
ConceptDraw DIAGRAM extended with Seven Management and Planning Tools Solution from the Management Area of ConceptDraw Solution Park is the best software for drawing all types of diagrams from the Seven Management and Planning Tools: Affinity Diagram, Relations Diagram, Prioritization Matrix, Root Cause Analysis Tree Diagram, Involvement Matrix, PERT Chart, and Risk Diagram (PDPC).
Picture: PDPC
Related Solution:
It is convenient to use a powerful ConceptDraw DIAGRAM software extended with Flowcharts Solution to design flowcharts of various types which will additionally illustrate a definition flowchart.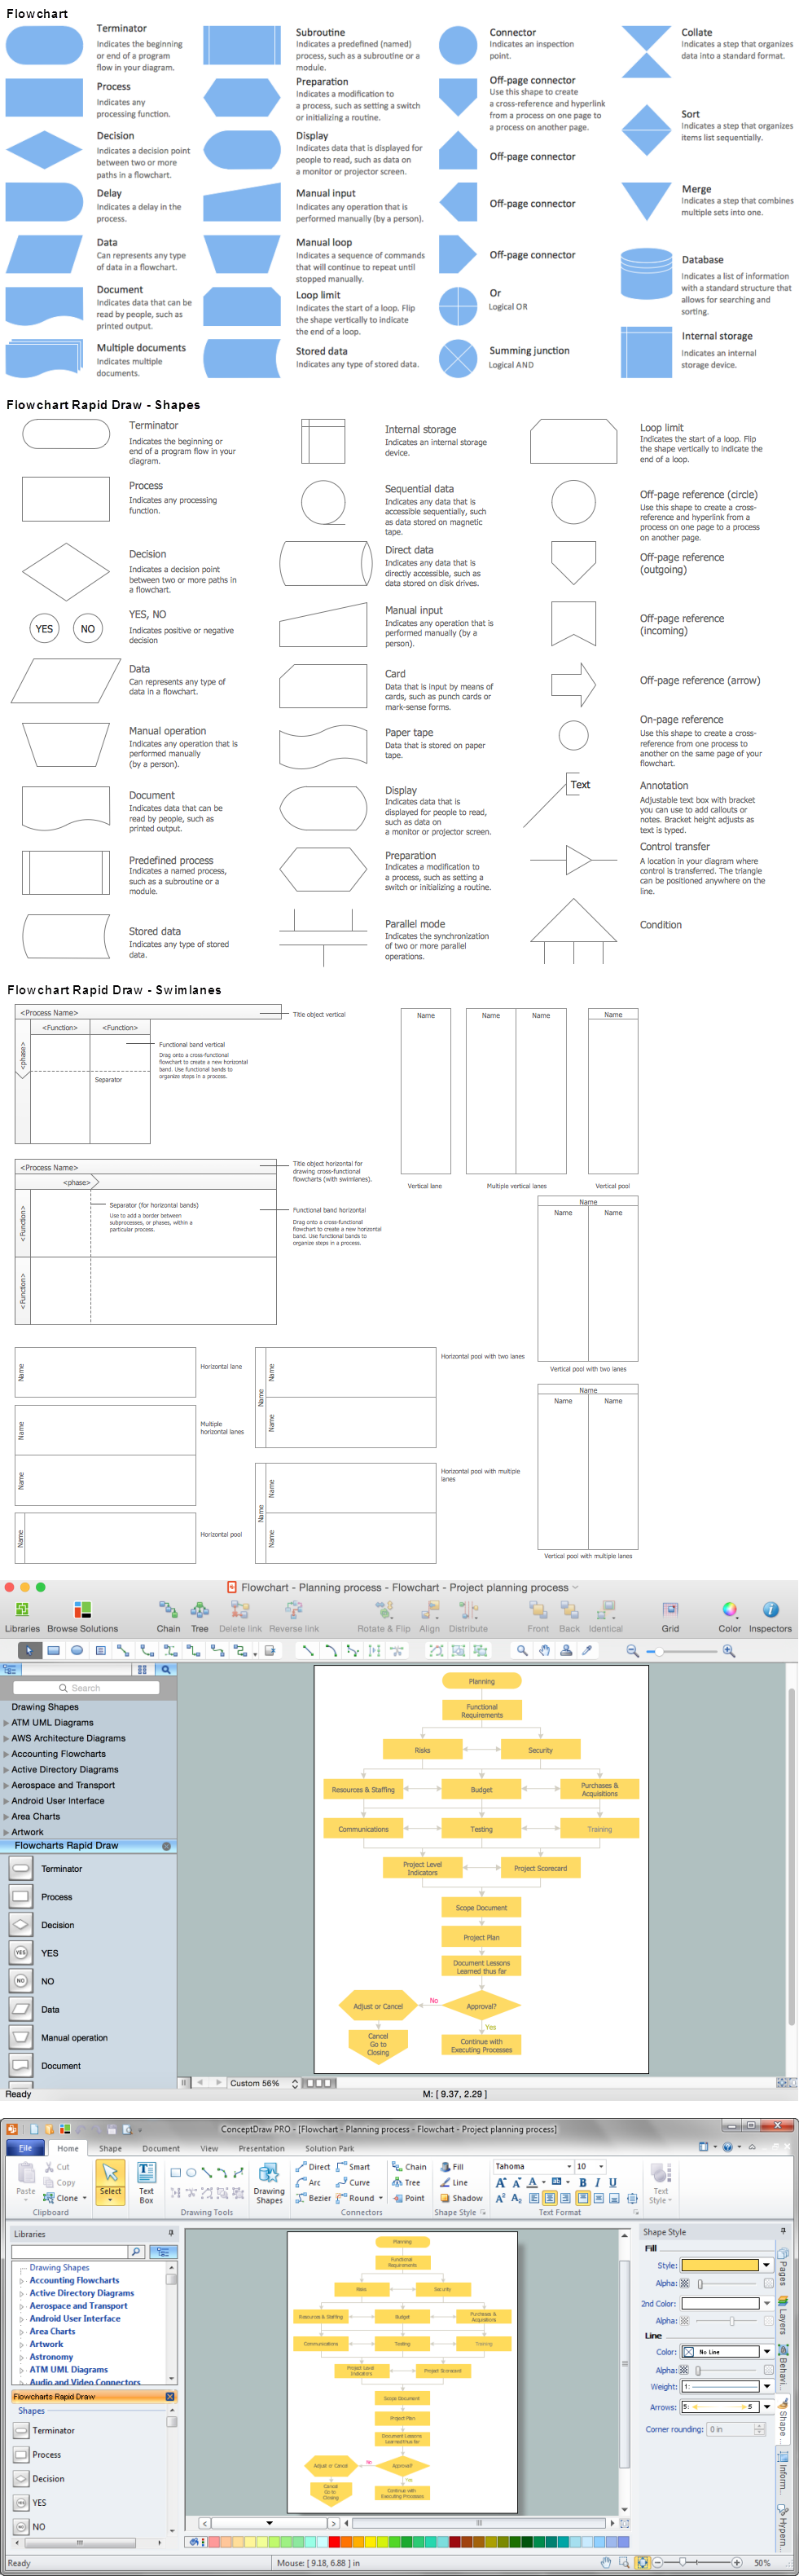
Picture: Definition Flowchart
Related Solution:
Relationships Analysis. Relations Diagram - factors analysis, factors relations. Create Relations Diagram with ConceptDraw DIAGRAM.
The Seven Management and Planning Tools is a tool for Interaction diagram drawing. This diagram identifies causal relationships. Determine what factors are causes and which factors are effects. Interaction diagram helps establish KPIs to monitor changes and the effectiveness of corrective actions in resolving the problem.
Picture: Relationships Analysis
You need to draw professional looking BPMN diagrams quick and easy? Pay please your attention on ConceptDraw DIAGRAM diagramming and vector drawing software. Extended with Business Process Diagram Solution from the Business Processes Area it will be ideal for your.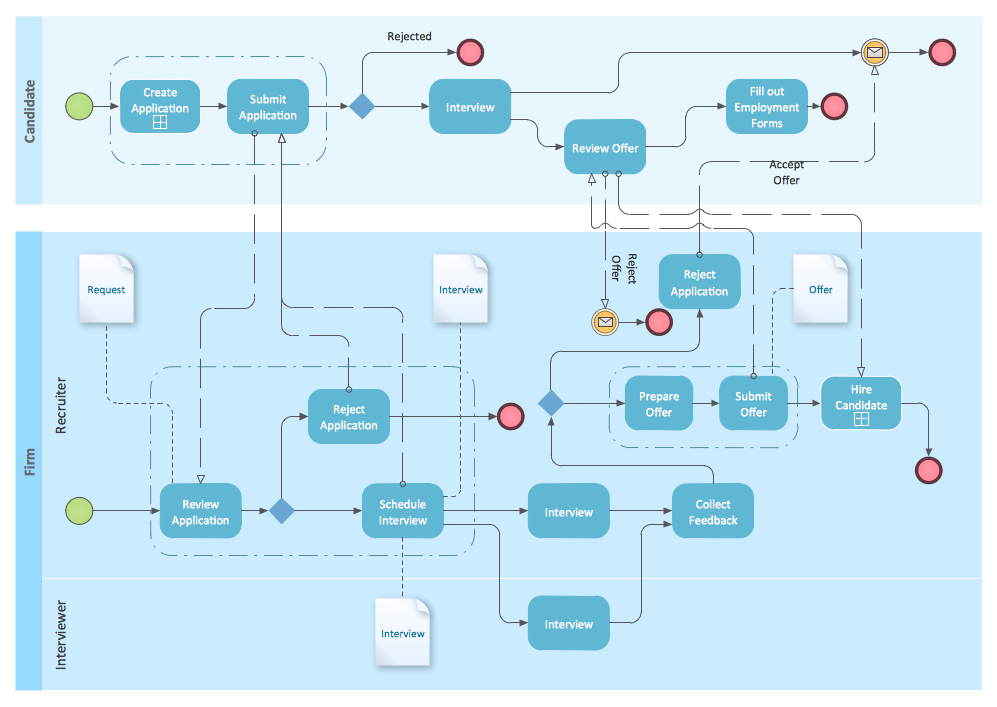
Picture: BPMN
Related Solution:
The Total Quality Management Diagram solution helps you and your organization visualize business and industrial processes. Create Total Quality Management diagrams for business process with ConceptDraw software.
Picture: TQM Diagram Tool
Related Solution:
ConceptDraw DIAGRAM application is perfect for creating workflow diagrams. This application contains specific features and technologies designed to draw diagrams faster, such as RapidDraw and Arrows10. ConceptDraw DIAGRAM software extended with the Workflow Diagrams solution gives you a flexible tool to draw any kind of workflow.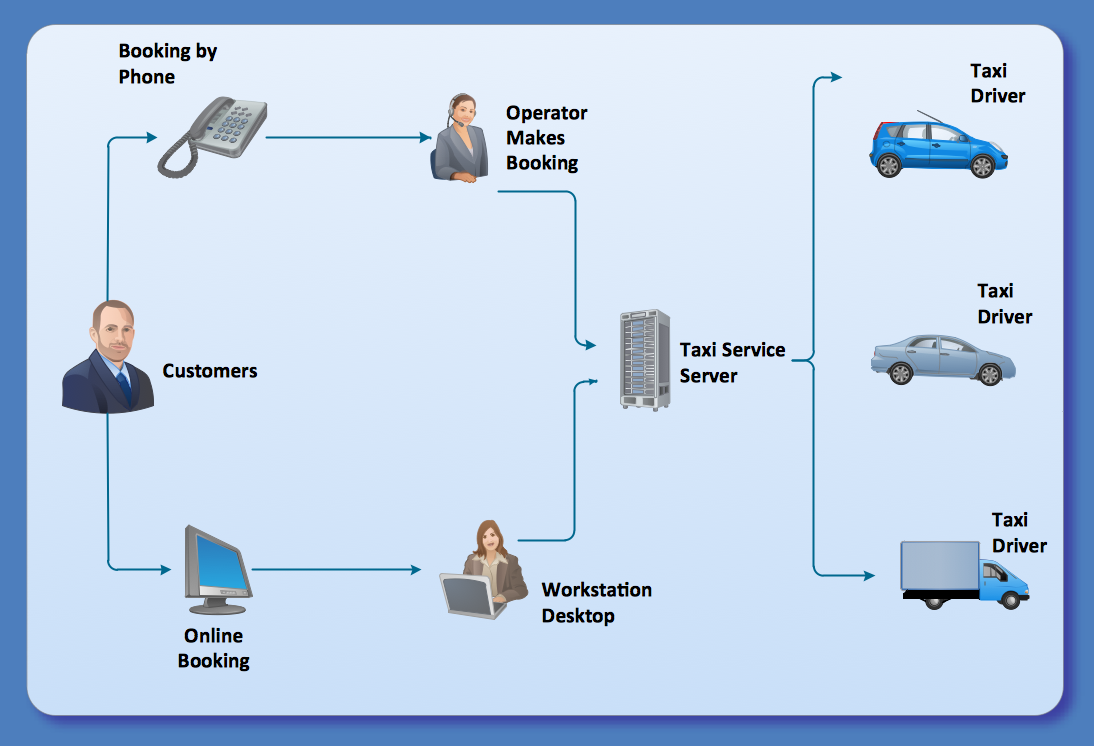
Picture: Workflow Application
Related Solution:
Diagramming software for Mac and PC - create flowcharts and presentations for Social Media Organizing.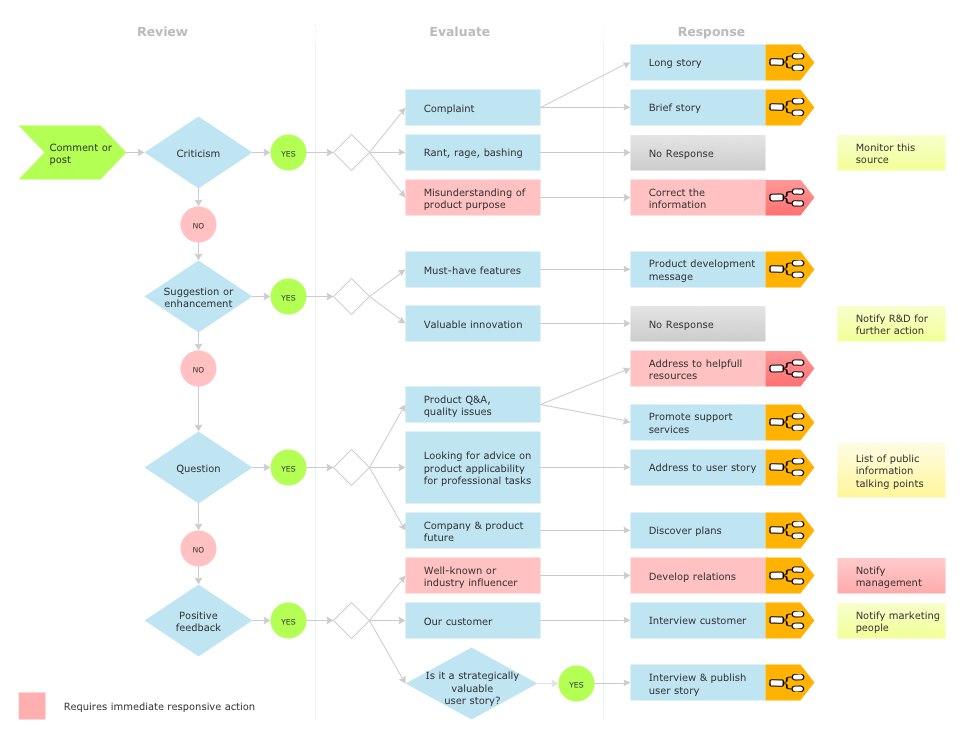
Picture: Social Media Response DFD Flowcharts - diagramming software ( Mac PC )
Related Solution:
ConceptDraw DIAGRAM is a professional software for building of great-looking Flowcharts ✔️ of various types and any degree of complexity, ✔️ in a few simple steps, ✔️ even if you have no experience, ✔️ using RapidDraw technology, ✔️ to perform different tasks in different fields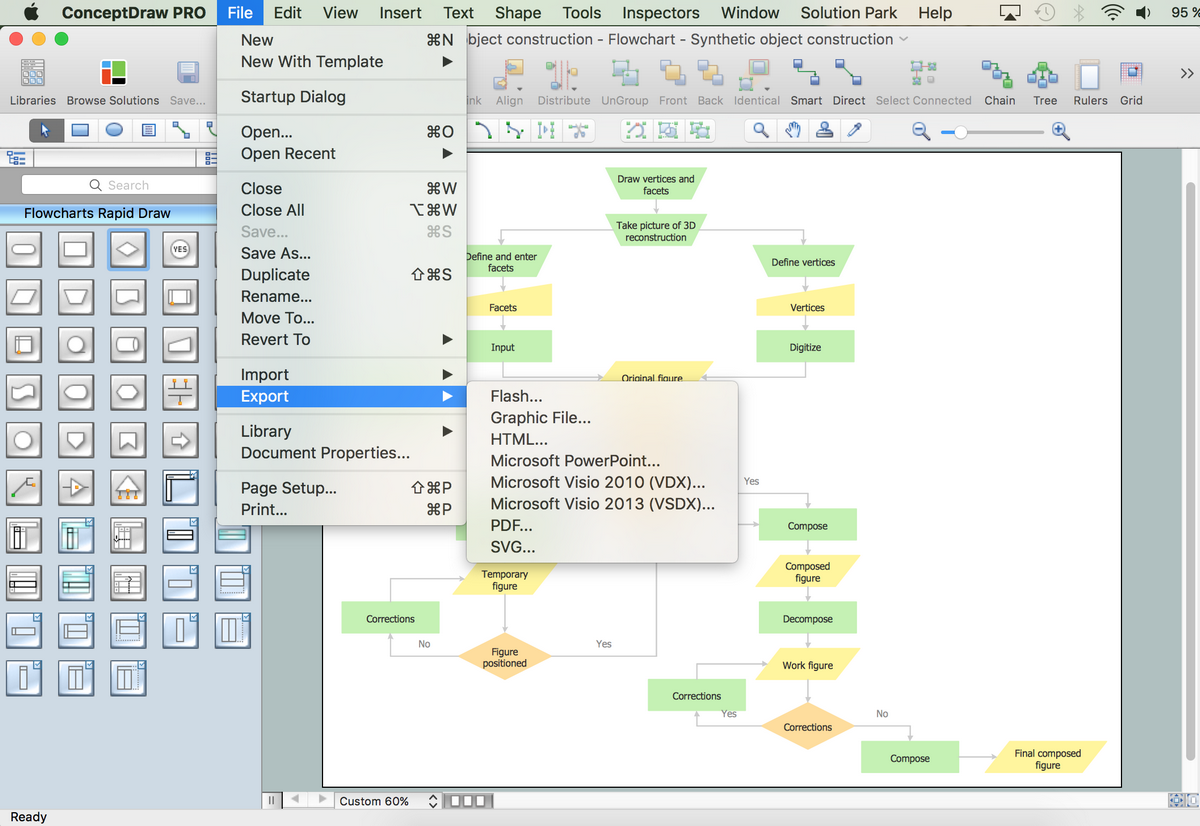
Picture: How to Build a Flowchart
Related Solution:
 flowchart symbols")