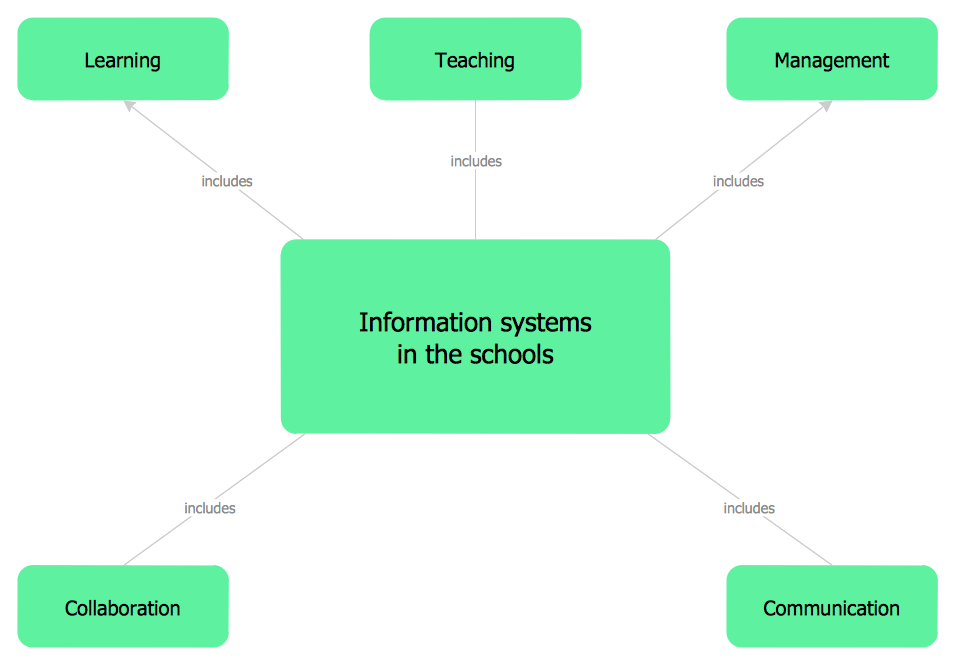
Example 1. Concept Mapping
How is it easy to realize the concept mapping in ConceptDraw DIAGRAM software which provides the useful tools within the Concept Maps Solution. Look at the Concept Maps Solution in ConceptDraw STORE!
You want to start the concept mapping with a ready template or sample? The ConceptDraw STORE offers the wide choice of them. Click on the desired preview to open the predesigned document in ConceptDraw DIAGRAM and make the required changes.

Example 2. Concept Maps Solution in ConceptDraw STORE
You can also use the library with professionally designed vector objects. All that you need is simply drag the desired objects, arrange them according to your idea and type the text.

Example 3. Concept Map - Team Psychological Characteristics
This Concept Map was created in ConceptDraw DIAGRAM using the Concept Maps Solution and visually illustrates the psychological characteristics of a team. An experienced user spent 20 minutes creating this sample.
Use the tools of Concept Maps Solution for quick, easy and effective concept mapping in ConceptDraw DIAGRAM software.
All source documents are vector graphic documents. They are available for reviewing, modifying, or converting to a variety of formats (PDF file, MS PowerPoint, MS Visio, and many other graphic formats) from the ConceptDraw STORE. The Concept Maps Solution is available for all ConceptDraw DIAGRAM or later users.
TEN RELATED HOW TO's:
Great examples of Infographic Maps, they are needed for inspiration.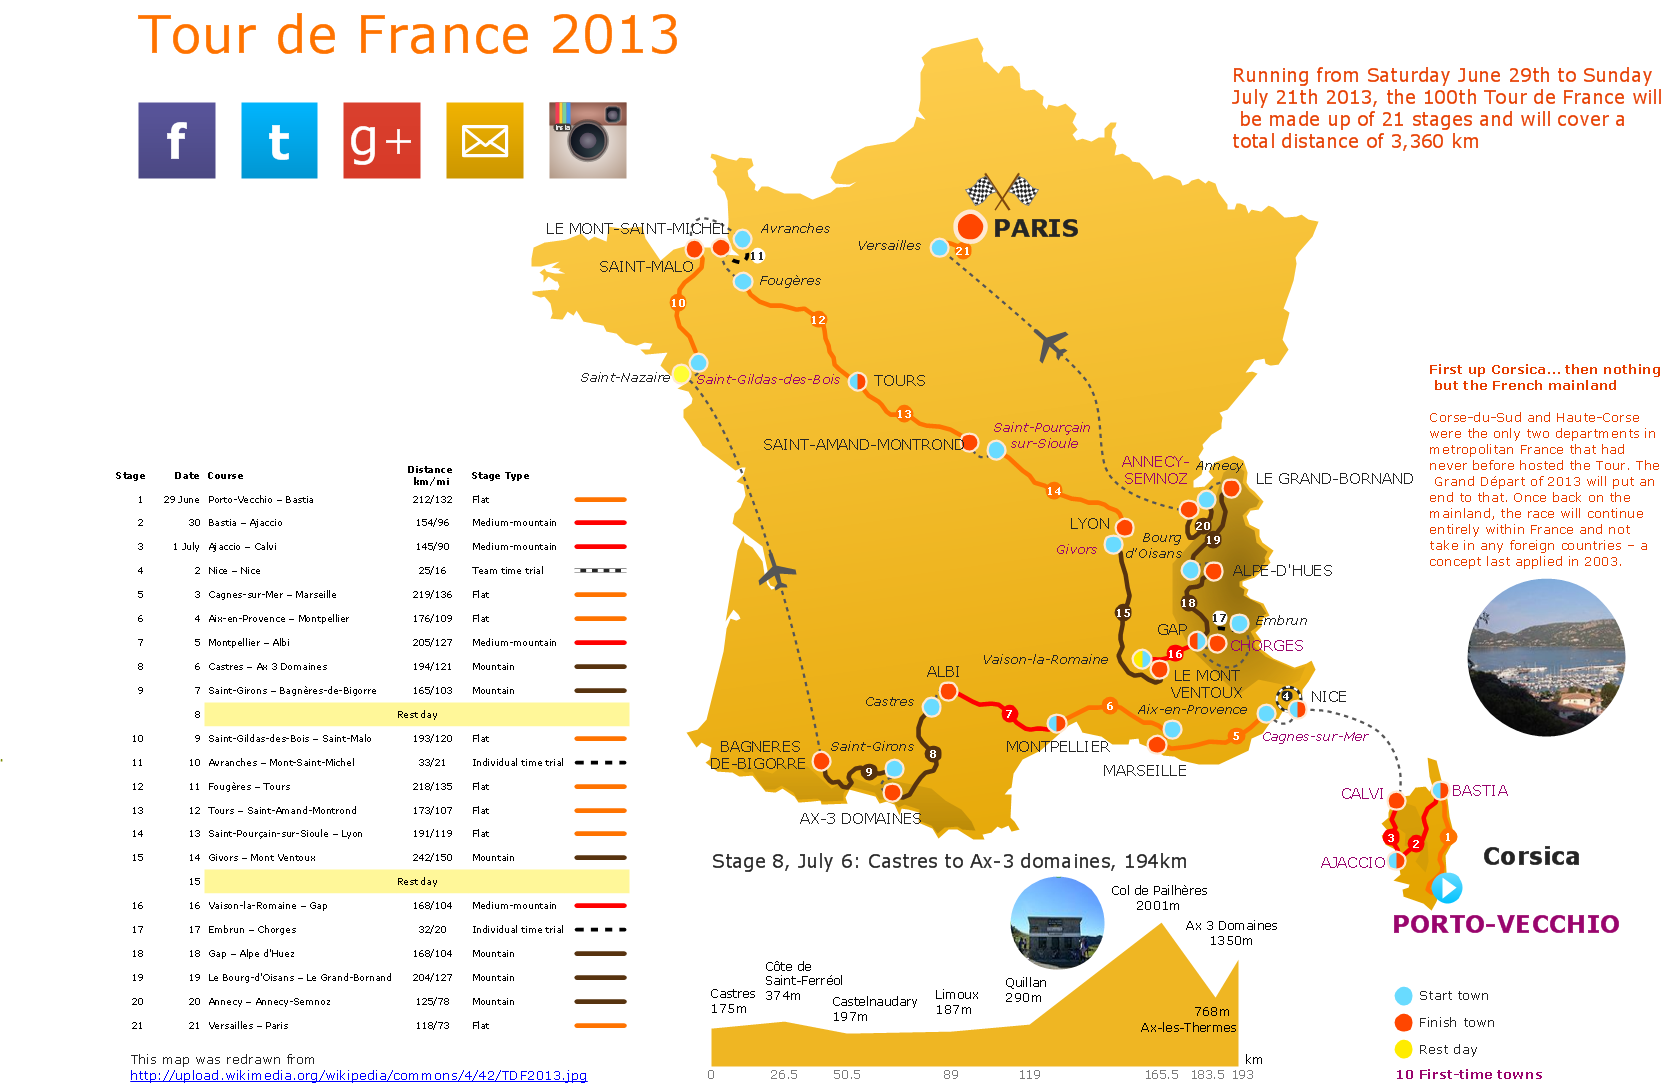
Picture: Superb Examples of Infographic Maps
This sample was created in ConceptDraw DIAGRAM diagramming and vector drawing software using the Business Process Diagram Solution from the Business Processes area of ConceptDraw Solution Park. The Business Process Solution is based on the standard BPMN 2.0 and includes the set of libraries of ready-to-use objects.
Picture: BPR Diagram. Business Process Reengineering Example
Related Solution:
Those triangles within any technical analysis are known to be the chart patterns that can be commonly found in the price charts of the financially traded assets, such as stocks, futures, bonds, etc. The pattern is known to be deriving its name from the fact that it is characterized by some contraction in a price range being the converged trend lines, giving it a triangular shape.
Picture: Pyramid Diagram
Related Solution:
ConceptDraw is rapid and powerful network diagram drawing software with rich examples, templates, design objects and stencils.
Picture: Draw Network Diagram based on Templates and Examples
Total Quality Management (TQM) system is the management method where the confidence in quality of all organization processes is placed foremost. The given method is widely used in production, in educational system, in government organizations and so on.
Picture: Total Quality Management with ConceptDraw
Rhineland-Palatinate is a southwest German state bordered by France, Belgium and Luxembourg. The capital city is Mainz.
Despite the fact that the maps surround us everywhere in our life, usually the process of their drawing is sufficienly complex and labor-intensive. But now, thanks to the ConceptDraw DIAGRAM diagramming and vector drawing software extended with Germany Map Solution from the Maps Area of ConceptDraw Solution Park, we have the possibility to make easier this process. Design fast and easy your own pictorial maps of Germany, map of Germany with cities, and thematic Germany maps in ConceptDraw DIAGRAM!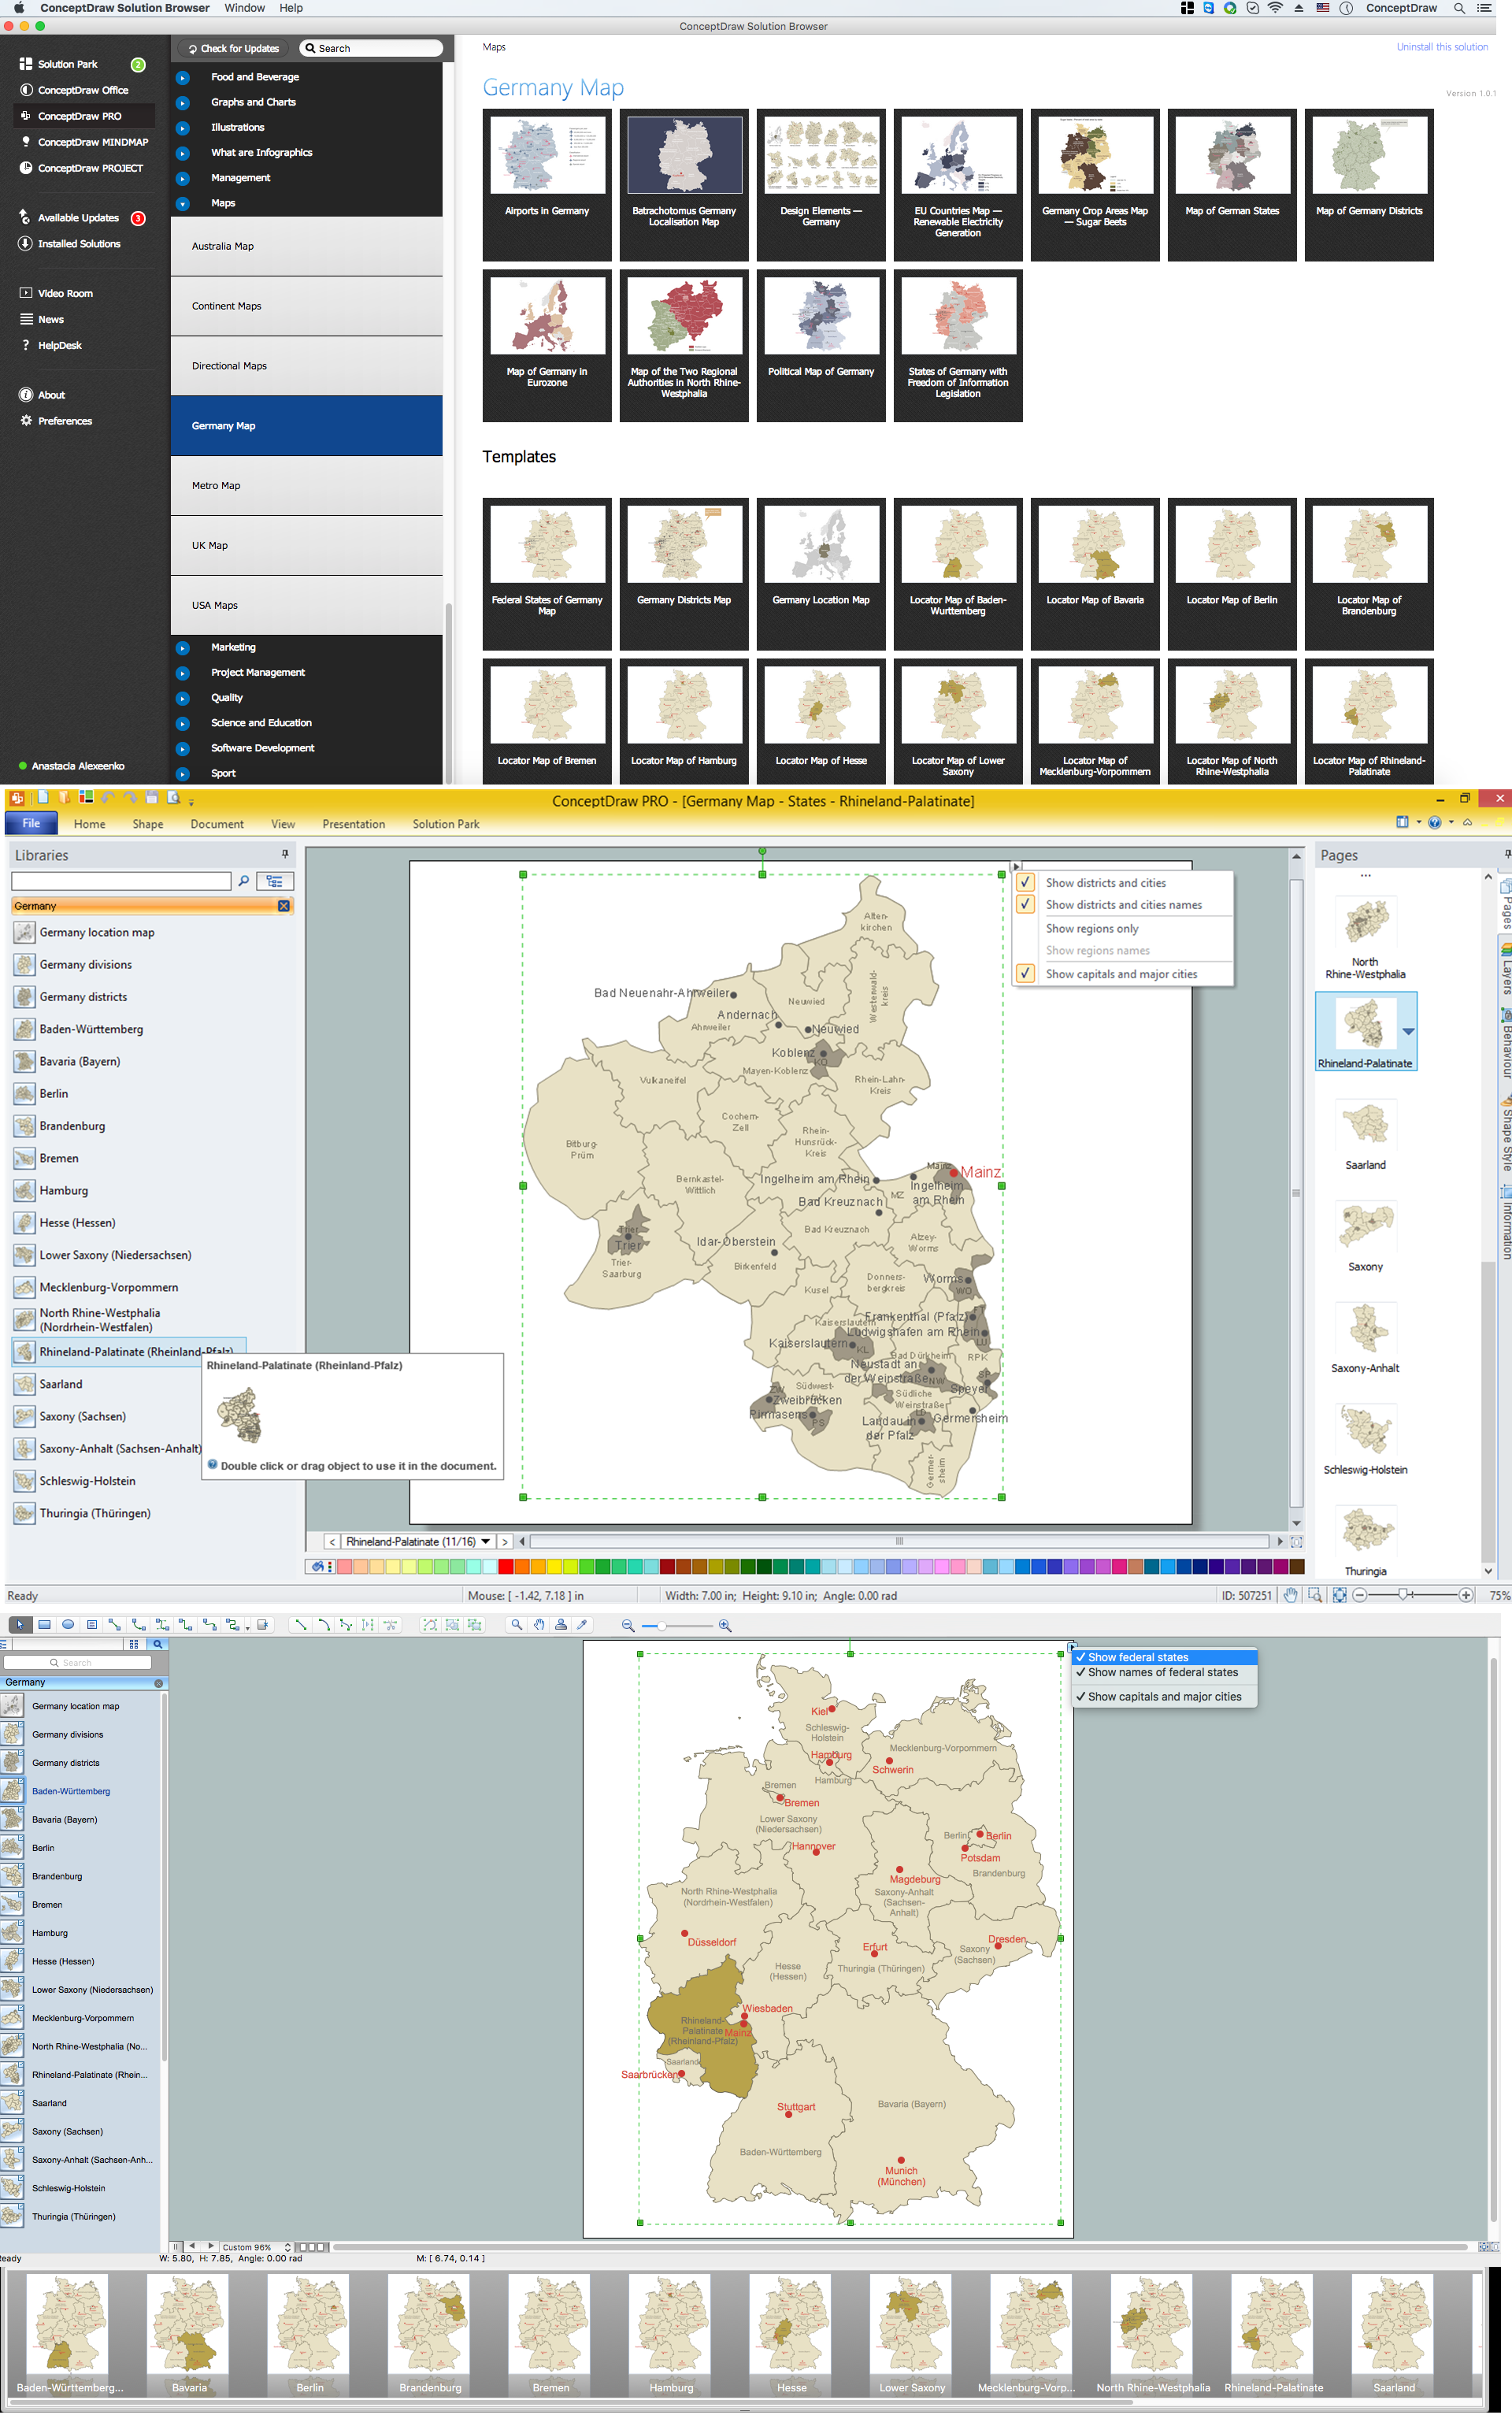
Picture: Map of Germany — Rhineland-Palatinate State
Related Solution:
Interactive tool helps you find the appropriate response to social media mentions quickly.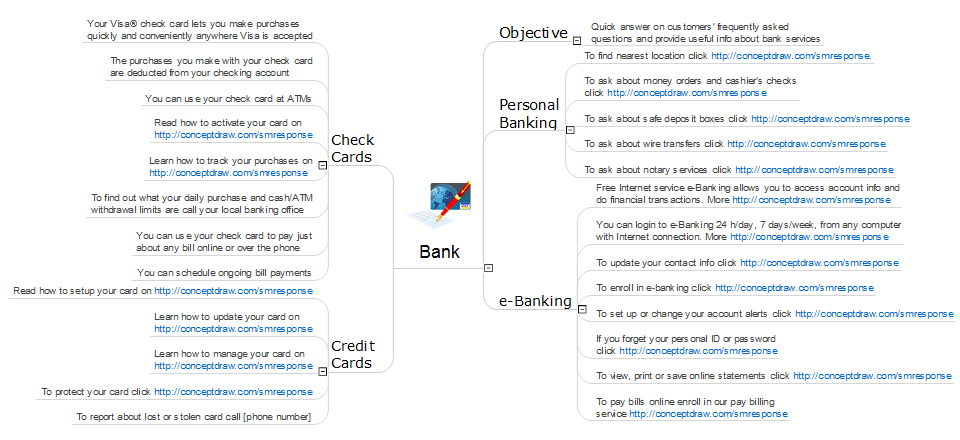
Picture: What Is an Action Mind Map
Related Solution:
ConceptDraw DIAGRAM diagramming and vector drawing software extended with Concept Maps Solution from the Diagrams Area is a powerful Concept Map Maker.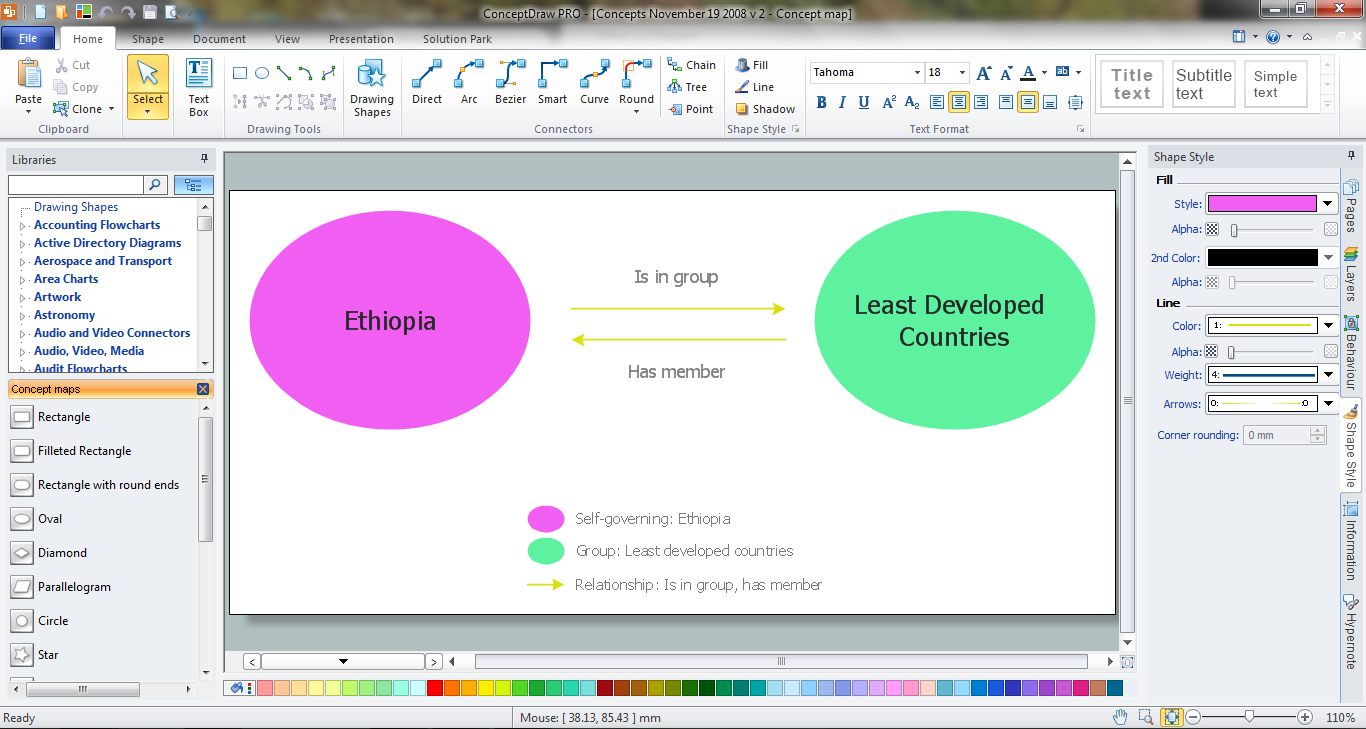
Picture: Concept Map Maker
Related Solution:
SWOT analysis is an effective method of business planning, the question is how to do it. The most obvious way is to make a SWOT analysis in a Word document, which is not very convenient. Luckily, you can use software like ConceptDraw DIAGRAM that has features and templates made especially for SWOT analyzing.
A SWOT Analysis is a manager's means of the strategic planning. It is used to define and classify considerable internal moments (strengths and weaknesses) and external forces (opportunities and threats) a business faces. You can use ConceptDraw MINDMAP to determine and organize factors utilized for SWOT analysis, and represent them in the SWOT matrix using ConceptDraw DIAGRAM. Using mind maps empowers you to explore and rank a lot of data engaged for SWOT analysis as well as recognize the relations between various pieces of information.
Picture: How to Make SWOT Analysis in a Word Document
Related Solution:
Use ConceptDraw DIAGRAM diagramming and vector drawing software enhanced with Computer and networks solution to draw different types of network diagrams: physical layout and topology, LAN and WAN, Cisco, Apple, Wi-Fi wireless and Ethernet wired networks, etc.
Special libraries of highly detailed, accurate shapes and computer graphics, servers, hubs, switches, printers, mainframes, face plates, routers etc.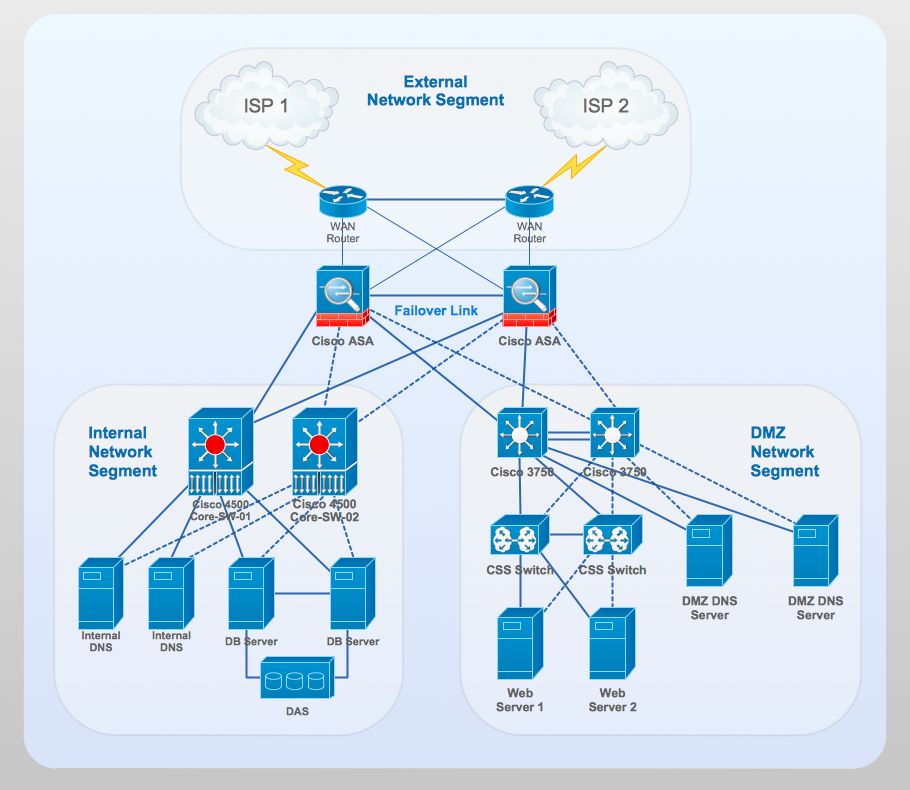
Picture: Network Gateway Router
Related Solution:

