Multi Layer Venn Diagram
Venn Diagram Example
A set is one of the key concepts of mathematics. The concept of the set is usually taken as one of the axiomatic concepts, that is, it can not be reduced to other concepts, and therefore has no definition. However, you can give a description of the set, as a collection of different elements, perceived as a whole.
Venn diagram shows all the possible relationships between sets or events of a certain family.
If element X belongs to a set M that is denoted by X ∈ M, and non-membership - X ∉ M. If the sets A and B are composed of the same elements, it is said that they are equal: A = B. Otherwise, the A and B sets are not equal (is denoted by A ≠ B). The set A is called a subset of the set B (denoted A ⊆ B), if every element of the set A is contained in the set B. In this case we also may say that B comprises the A or is a superset of A (denoted by B ⊇ A). The set A is called a proper subset of B (denoted A ⊂ B), if A ⊆ B and A ≠ B, i.e. B has elements that are not contained in A.
A set containing a finite number of elements is called finite, otherwise - infinite. The number of elements of a finite set M is called its power.
The set which doesn’t contain any elements is called empty (denoted by ∅). By definition, ∅ is equal to zero. It is believed that the empty set is a subset of any set. The basic operations on sets are union, intersection, difference and addition.
Union of sets A and B (denoted by AUB) is a set of elements, each of which belongs to either A or B. Thus, a random element X ϵ АUВ if and only if either X ϵ A, and X ϵ B.
Intersection of sets A and B (denoted by A∩B) is the set consisting of all those and only those elements which belong to both set A and set B.
Difference between the sets A and B (denoted by A B) is the set of all those and only those elements of A that are not contained in B.
A logical complement of A (denoted Ā or ¬A) is the set of all those elements that do not belong to the set A.
This sample was created in ConceptDraw DIAGRAM software using the Business Diagrams Solution from the Management area of ConceptDraw Solution Park.
This example shows the radially-symmetrical 5 set Venn Diagram. The Venn Diagrams visualize all possible logical relations between several sets and are widely used in mathematics, logic, statistics, marketing, sociology, philosophy, etc.

Example 1. Multi Layer Venn Diagram
Using the ready-to-use predesigned objects, samples and templates from the Business Diagrams Solutionn for ConceptDraw DIAGRAM you can create your own professional-looking Venn Diagrams quick and easy.
The Venn Diagrams produced with ConceptDraw DIAGRAM are vector graphic documents and are available for reviewing, modifying, and converting to a variety of formats (image, HTML, PDF file, MS PowerPoint Presentation, Adobe Flash or MS Visio).
TEN RELATED HOW TO's:
A database is a data collection, structured into some conceptual model. Two most common approaches of developing data models are UML diagrams and ER-model diagrams. There are several notations of entity-relationship diagram symbols and their meaning is slightly different. Crow’s Foot notation is quite descriptive and easy to understand, meanwhile, the Chen notation is great for conceptual modeling.
An entity relationship diagrams look very simple to a flowcharts. The main difference is the symbols provided by specific ERD notations. There are several models applied in entity-relationship diagrams: conceptual, logical and physical. Creating an entity relationship diagram requires using a specific notation. There are five main components of common ERD notations: Entities, Actions, Attributes, Cardinality and Connections. The two of notations most widely used for creating ERD are Chen notation and Crow foot notation. By the way, the Crow foot notation originates from the Chen notation - it is an adapted version of the Chen notation.
Picture: ERD Symbols and Meanings
Related Solution:
To begin managing a new project, you will need to define the individual Tasks that must be completed to deliver it. The default view for a new project in ConceptDraw PROJECT is the Gantt Chart.
Picture: How to Create Gantt Chart
When thinking about data visualization, one of the first tools that comes to mind is a flowchart design. You can find flowchart symbols, shapes, stencils and icons easily on the Internet, but it might take time to systematize this information. Nevertheless, once you start flowcharting, you’ll love its simplicity and efficiency.
This diagram consists from standard flowchart symbols, approved by ANSI (American National Standard Institute) for drawing flowcharts. A flowchart is a diagram that represents a step-by-step algorithm of any process, displaying the process stages as boxes that are connected with arrows. Flowchart design makes it clear and readable.
Flowchart designed using ConceptDraw DIAGRAM flowchart software allows to make attractive and clear process presentation, it makes interpretation of the business process flow fresh and versatile. Great flowchart design view is a big advantage over the diagram created manually on a paper.
Picture: Flowchart Design: Principles, Layout, Symbols and Best Practices
Related Solution:
A flowchart is a simple but very functional tool when it comes to understanding a workflow or to removing unnecessary stages from a process. When drawing flowcharts, keep in mind that there are four common types of flowcharts, like document flowcharts and data flowcharts that show control over a data or document flow over a system. To show controls on a physical level, use system flowcharts. In addition, to show controls in a program, you can draw a program flowchart.
This flowchart diagram represents the piece of an article editing process, that involves the author and editor. It was created using the Basic Flowchart notation that consists from the basic flowchart symbols. The start and the end of the process are indicated with "Terminator" symbols. The "Process" symbols show the action steps consisting from making edits and searching for a compromise, when the author does not agree with the suggestions of the editor. The "Process" symbol is the general symbol in process flowcharts. The "Decision" symbol indicates a branching in the process flow. There are two branches indicated by a Decision shape in the current flowchart (Yes/No, Disagree/Agree). This basic flowchart can be used as a repeating unit in the workflow diagram describing the working process of some editorial office.
Picture: Types of Flowcharts
Related Solution:
Venn diagrams are illustrations used in the branch of mathematics known as set theory.
Create your Venn diagrams for logic problem solving using the ConceptDraw DIAGRAM software
Picture:
Venn Diagram Examples for Problem Solving
Venn Diagram as a Truth Table
Related Solution:
Draw detailed Computer Network Diagrams, Designs, Schematics, and Network Maps with ConceptDraw DIAGRAM in no time! Pre-drawn shapes representing computers, network devices plus smart connectors help create accurate diagrams and documentation.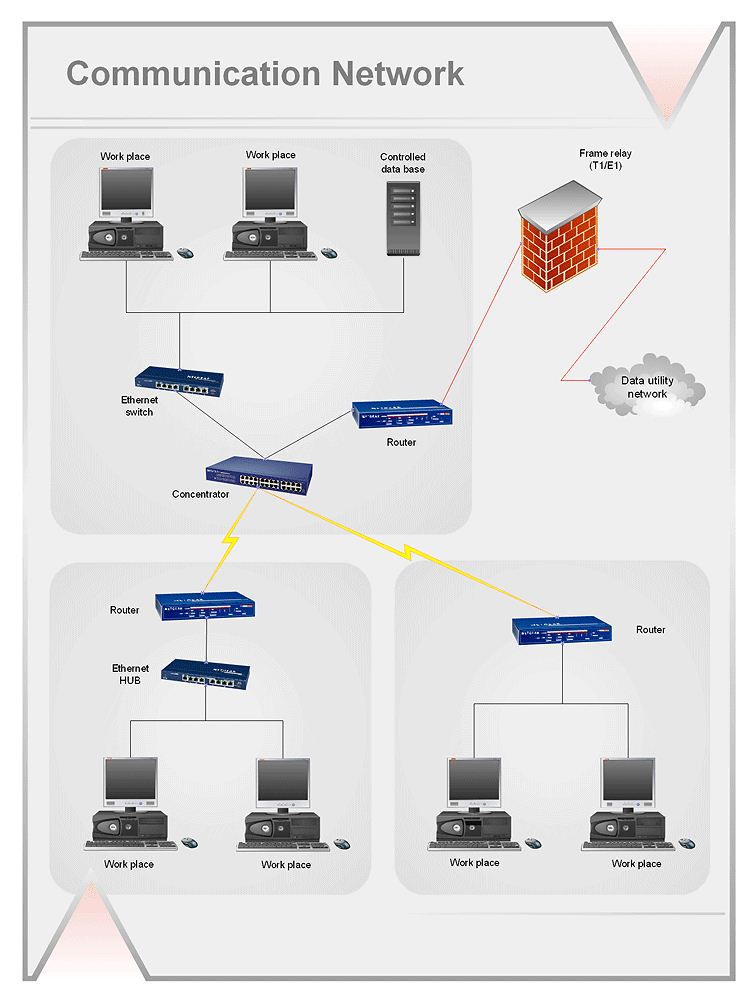
Picture: Network Diagramming with ConceptDraw DIAGRAM
How should diagramming software work? The answer is - Fast and easy.
Tree- mode drawing works like that. Just select objects in your drawing and press Tree or Chain button to connect all of them just in one click.
Your diagram looks professional and it took only a moment to draw.
Picture: ConceptDraw Arrows10 Technology
Venn Diagrams visualize all possible logical intersections between several sets and are widely used in mathematics, logic, statistics, marketing, sociology, philosophy, etc.
Using the ConceptDraw DIAGRAM you can create your own professional looking Venn Diagrams quick and easy.
Picture: Venn Diagram Template for Word
Related Solution:
Using ConceptDraw you will be able to create bubble diagrams from the ready ConceptDraw library objects or make your own objects. The created diagram can be saved and edited, objects can be moved and links between them will be automatically repainted after object moving because of using the ConceptDraw connectors.
Picture: Bubble diagrams with ConceptDraw DIAGRAM
Related Solution:
Using the Business Diagrams Solution you can create your own professional-looking Venn Diagrams quick and easy.
Picture: 3 Circle Venn Diagram. Venn Diagram Example
Related Solution: