
Example 1. Venn diagram as a truth table
"A truth table is a mathematical table used in logic—specifically in connection with Boolean algebra, boolean functions, and propositional calculus—to compute the functional values of logical expressions on each of their functional arguments, that is, on each combination of values taken by their logical variables (Enderton, 2001). In particular, truth tables can be used to tell whether a propositional expression is true for all legitimate input values, that is, logically valid."
[Truth table. Wikipedia]
The Venn diagram example above was redesigned from the Wikipedia file: Venn3tab.svg.
[en.wikipedia.org/wiki/File:Venn3tab.svg]
NINE RELATED HOW TO's:
ConceptDraw DIAGRAM diagramming and vector drawing software provides the Telecommunication Network Diagrams Solution from the Computer and Networks Area for quick and easy drawing the Telecommunications Networks.
Picture: Telecommunications Networks
Related Solution:
macOS is used increasingly often as a productivity platform by many companies and businesses across the world. SWOT Analysis is an essential business tool for companies to determine their future course of action. As a tool for digital drawing of SWOT Analysis diagrams under macOS, ConceptDraw offers Mac Tools - SWOT Analysis examples and templates are included to allow for effortless creation of SWOT and TOWS Analysis diagrams. With ConceptDraw it is equally easy to create your SWOT Analysis diagram under Microsoft Windows and macOS.
This image demonstrates the diversity of SWOT and TOWS matrix templates delivered with SWOT and TOWS Diagrams add-on for ConceptDraw DIAGRAM diagramming software. Together they compose a professional solution for performing SWOT and TOWS analysis. There are number of templates of different Matrix Diagrams. In addition to the set of embedded templates, this solution allows one to design SWOT and TOWS matrices tailored to certain business characteristics or corporate style. Using matrix template, you can easily discover Strengths, Weaknesses, Opportunities, and Threats, your business faced. This means that the first step to creating a successful business strategy, you have done.
Picture: Mac Tools - SWOT Analysis
ConceptDraw DIAGRAM diagramming and vector drawing software extended with Computer Network Diagrams Solution from the Computer and Networks Area offers a set of useful tools, collection of templates, samples, and libraries of various computer symbols, computer devices icons, computer network icon for fast and easy drawing network computer diagrams and illustrations.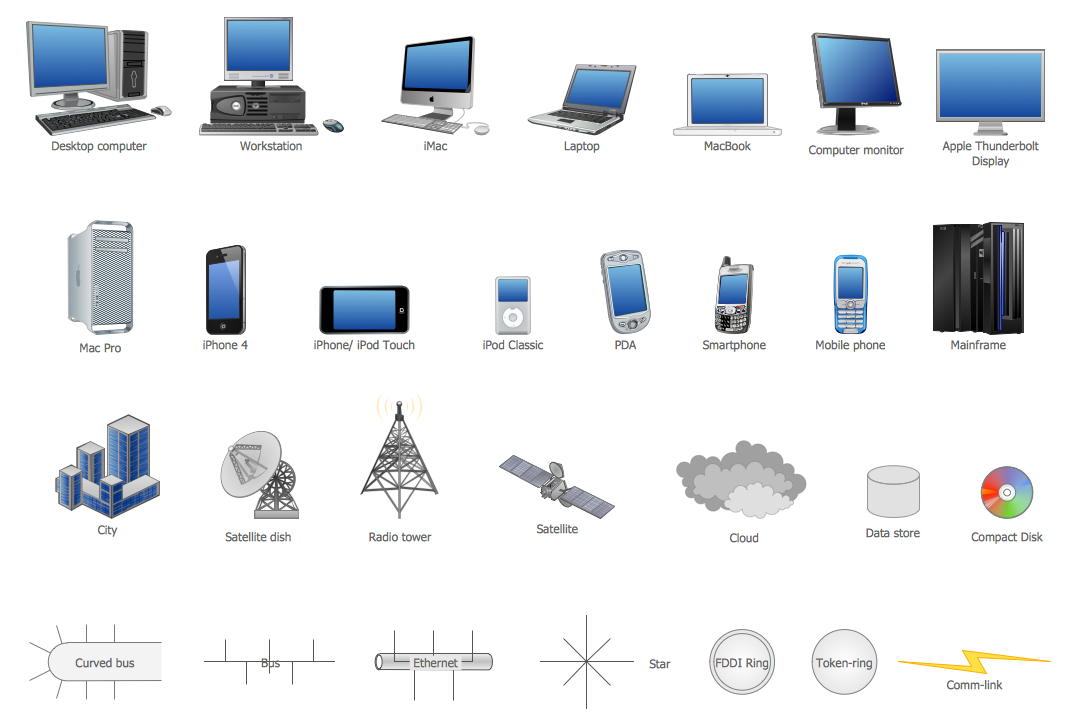
Picture: Network Icon
Related Solution:
A competent delegation of responsibilities between workers guarantees business success in most cases. At first sight, it might seem that workflow diagram symbols are quite similar to a regular flowchart. But workflow diagram is a more accurate way to present working processes.
Workflow diagrams are helpful for a working process analyzation, to depict a pathway of process issues, personalize responsibilities and identify resources that will help to optimize a workflow. Generally, Workflow diagram deploys flowchart symbols for displaying work process steps and relationships. But, often it require some additions and improvements to become more professional and illustrative. The Workflow solution for ConceptDraw DIAGRAM provides the user with a big library of symbols that are designed especially for workflow diagrams.
Picture: Workflow Diagram Symbols
Related Solution:
ConceptDraw Business Finance Illustration examples and libraries contain vector clip art for drawing different Business and Finance Illustrations. You may find Advertising example, Project Management example, Business Model example and many more.
Picture: Business and Finance Illustrations Example
Related Solution:
UML state machine's goal is to overcome the main limitations of traditional finite-state machines while retaining their main benefits.
ConceptDraw has 393 vector stencils in the 13 libraries that helps you to start using software for designing your own UML Diagrams. You can use the appropriate stencils of UML notation from UML State Machine library.
Picture: UML State Machine Diagram.Design Elements
Related Solution:
ConceptDraw DIAGRAM diagramming software provides vector shapes and connector tools for quick and easy drawing diagrams for business, technology, science and education.
Use ConceptDraw DIAGRAM enhanced with solutions from ConceptDraw Solution Park to create diagrams to present and explain structures, process flows, logical relationships, networks, design schemes and other visually organized information and knowledge.
Picture: Cross-Functional Flowchart - The easiest way to draw crossfunctional
Venn diagrams are illustrations used in the branch of mathematics known as set theory.
Use ConceptDraw DIAGRAM to quick and easy design your own Venn Diagram of any complexity.
Picture: Venn Diagram
Related Solution:
Big and complex projects sometimes need some simplification of plans and schedules. That's why Program Evaluation and Review Technique was invented and first implemented in 1958. You can create PERT diagrams effortlessly with ConceptDraw DIAGRAM and share them with your colleagues.
Program Evaluation Review Technique (PERT) is a method that is used to assess and analyze projects. PERT is a valuable tool for the project management practice. PERT gives an assessment and analysis of the time needed to the project completion. A PERT chart is a visual tool that delivers a graphical view of a project timeline. It is used to display the sequences and dependences of project tasks necessary to complete a project. ConceptDraw DIAGRAM delivers the possibility to build a PERT along with other diagrams applied to assist management process by using its Seven Management and Planning Tools solution.
Picture: Program Evaluation and Review Technique (PERT) with ConceptDraw DIAGRAM
Related Solution: