
Example 1. Onion Diagram Templates - Elliptical Onion Diagram
What can be easier than simply fill a ready template? The Stakeholder Onion Diagrams Solution provides 3 different Onion Diagram templates for any taste. All templates and also Stakeholder Onion Diagrams samples are available from ConceptDraw STORE.

Example 2. Onion Diagram Templates in ConceptDraw STORE
Simply click a suitable Stakeholder Onion Diagram template in ConceptDraw STORE and it will be immediately opened in ConceptDraw DIAGRAM application. Now, you can fill it with your own data, type the text and title, make color style changes if needed.

Example 3. Onion Diagram Templates - Onion Diagram with 3 Sectors
It is also effective to depict the interactions between the items on your Onion Diagram and to add the legend using the ready vector objects from the Stakeholder Icons library for Stakeholder Onion Diagrams solution. All this makes your diagram more complete, extensive and clear even from the first sight.

Example 4. Onion Diagram Templates - Round Onion Diagram
The Onion Diagram templates you see on this page were created in ConceptDraw DIAGRAM software and are included to the Stakeholder Onion Diagrams solution for ConceptDraw Solution Park.
Use the Stakeholder Onion Diagrams Solution for fast, easy and effective creation your own professional looking Onion Diagrams of any complexity.
All source documents are vector graphic documents. They are available for reviewing, modifying, or converting to a variety of formats (PDF file, MS PowerPoint, MS Visio, and many other graphic formats) from the ConceptDraw STORE. The Stakeholder Onion Diagrams Solution is available for all ConceptDraw DIAGRAM users.
TEN RELATED HOW TO's:
Affinity Diagram Software - ConceptDraw DIAGRAM is a powerful diagramming and vector drawing software that allows quick, easy and effective create the Affinity Diagrams.
Seven Management and Planning Tools solution from the Business Productivity area of ConceptDraw Solution Park provides templates, samples and ready-to-use vector stencils that will help you design the professional looking Affinity Diagrams in a few moments.
Picture: Affinity Diagram Software
Related Solution:
The Bubble Map is a popular tool for visualization a data set which is widely used in economics, medicine, software engineering, architecture, and many other fields. Each bubble on the Bubble Map is characterized by coordinates, color and size. ConceptDraw DIAGRAM diagramming and vector drawing software extended with Business Diagrams Solution from the Management Area is a powerful Bubble Map Maker.
Picture: Bubble Map Maker
Related Solution:
There are many tools to manage a process or to illustrate an algorithm or a workflow. Flowcharting is one of those tools. However, it may be difficult to show complex processes that require multiple attributes or several people in a simple flowchart, so a cross-functional flowchart would be a solution for that situation. To create such flowchart, group processes and steps to labeled rows or columns, and divide those groups with horizontal or vertical parallel lines. It is worth mentioning that there are different types of cross-functional flowcharts, like opportunity or deployment flowchart.
This diagram shows a cross-functional flowchart that was made for a trading process. It contains 14 processes, distributed through 5 lines depicting the participants who interact with the process. Also there are connectors that show the data flow of information between processes. The cross-functional flowchart displays a detailed model of the trading process, as well as all participants in the process and how they interact with each other. The lines in the flowchart indicates the position, department and role of the trading process participants.
Picture: Cross-Functional Flowchart
Related Solution:
Electrical plan is a document that is developed during the first stage of the building design. This scheme is composed of conventional images or symbols of components that operate by means of electric energy. To simplify the creation of these schemes you can use house electrical plan software, which will not require a long additional training to understand how to use it. You only need to install the necessary software ant it’s libraries and you’ll have one less problem during the building projection.
Any building contains a number of electrical systems, including switches, fixtures, outlets and other lightening equipment. All these should be depicted in a building electrical plans and included to general building documentation. This home electrical plan displays electrical and telecommunication devices placed to a home floor plan. On the plan, each electrical device is referenced with the proper symbol. Electrical symbols are used for universal recognition of the building plan by different persons who will be working on the construction. Not all possible electric symbols used on a certain plan, so the symbols used in the current home plan are included to a legend. The electrical home plan may be added as a separate document to a complete set of building plans.
Picture: How To use House Electrical Plan Software
Related Solution:
Using ConceptDraw DIAGRAM, you can save diagrams as a Web pages. ConceptDraw DIAGRAM adds the HTML tags that are needed to display your diagrams in a Web browser, so all you have to do is design their appearance.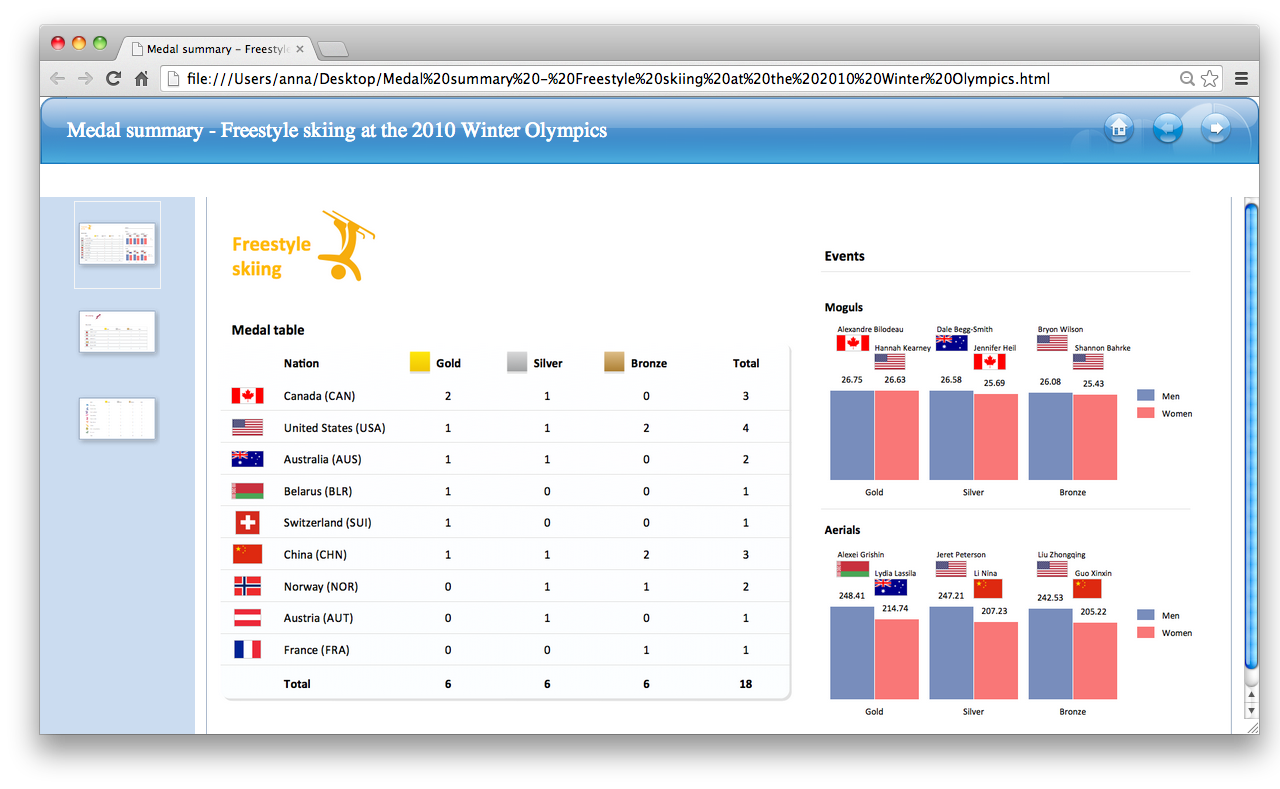
Picture: Export from ConceptDraw DIAGRAM Document to HTML
The Entity-Relationship Diagram (ERD) solution from ConceptDraw Solution Park extends ConceptDraw DIAGRAM vector graphics and diagramming software with the ability to describe a database using the Entity-Relationship (Chen) model. Use it for design your ERDs and verify that ConceptDraw DIAGRAM offers the best ERD diagrams software tools for design element Chen notation._Win_Mac.png)
Picture: Entity Relationship Diagram - ERD - Software for Design Chen ER Diagrams
Related Solution:
The Total Quality Management Diagram solution helps your organization visualize business and industrial processes. Create Total Quality Management diagrams for business process with ConceptDraw software.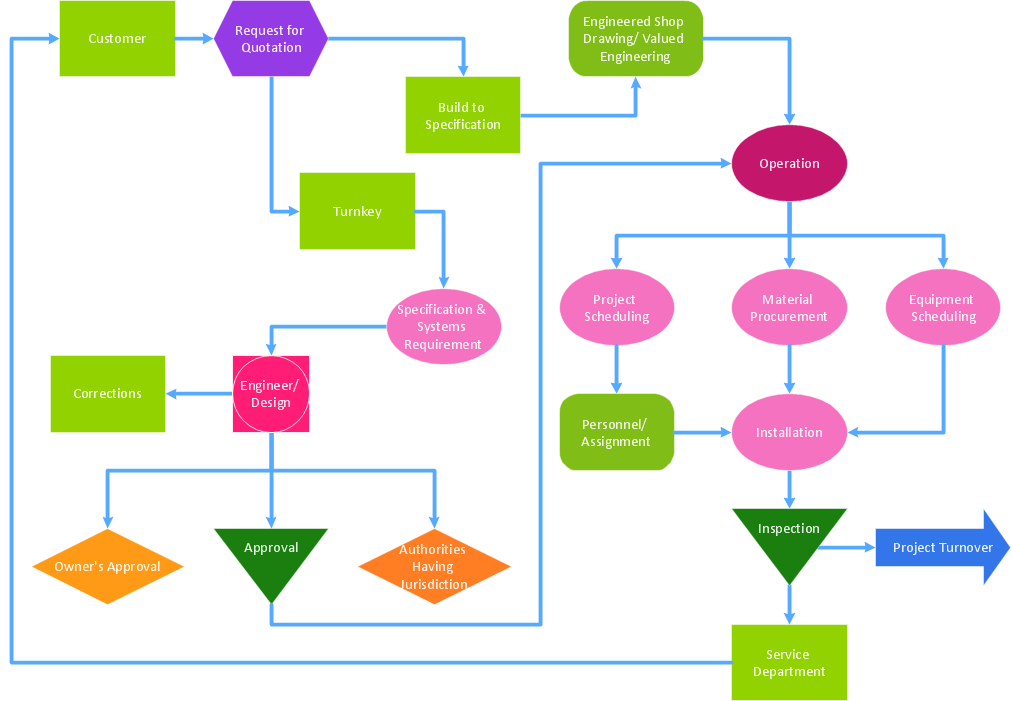
Picture: Best Value — Total Quality Management
Related Solution:
ConceptDraw MINDMAP with the ability to import presentations from Microsoft PowerPoint, as well as enhancing its existing presentation capabilities.
Picture: Best Mind Mapping Program for Making Presentations
Related Solution:
ConceptDraw DIAGRAM extended with Data Flow Diagrams solution is the best diagramming and vector drawing software for quick and easy designing the Data Flow Diagram Example of any complexity.
Picture: Data Flow Diagram Example
Related Solution:
You can design the Prioritization Matrix by hand on the paper, but we offer you the most easier way — to use the ConceptDraw DIAGRAM diagramming and vector drawing software extended with Seven Management and Planning Tools Solution from the Management Area.
Picture: Prioritization Matrix
Related Solution:


