Active Directory Network. Computer and Network Examples
Active Directory Networks plans can be created the same way as many other drawings, including the network diagrams: by using the modern and progressive ConceptDraw DIAGRAM diagramming and drawing software developed by CS Odessa same way as the ConceptDraw STORE — an application that includes many different solutions, such as the Computer Network Diagrams one.

Example 1. Active Directory Network Diagrams Solution
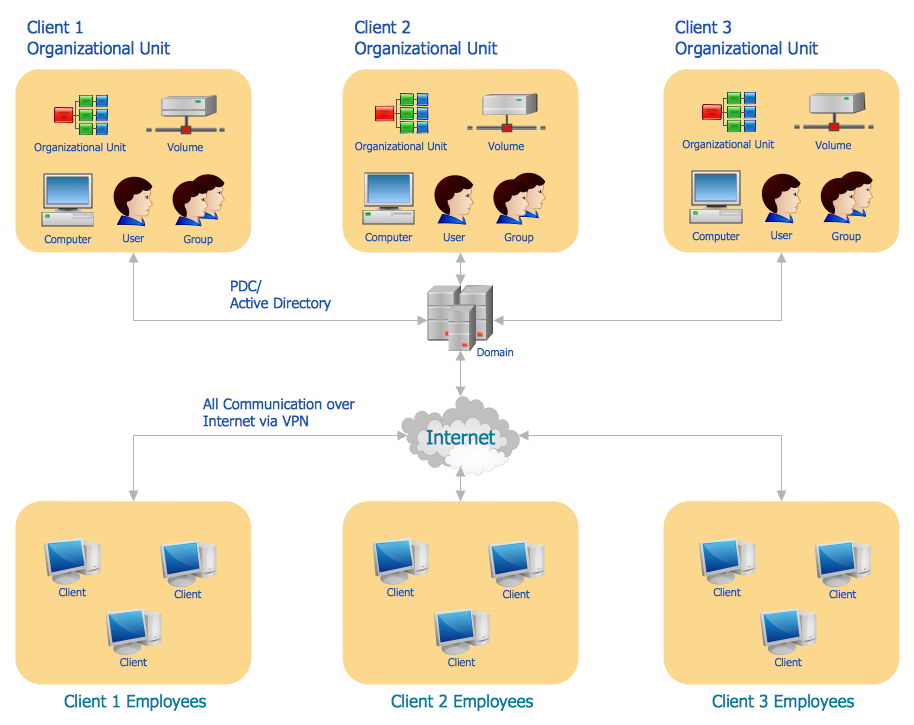
An active directory is a directory service that Microsoft developed especially for Windows domain networks and that is included in most so-called “Windows Server operating systems” as a set of different services and processes. Originally, the mentioned Active Directory was only in charge of the centralized domain management, but starting with Windows Server 2008 it became an umbrella title for lots of identity-related as well as directory-based services.
That server that runs Active Directory Domain Services can be called as a “domain controller”. It is known to be authorizing and authenticating all computers and users in a Windows domain type network. It can be also used for enforcing and assigning the security policies for all the computers as well as updating/installing the needed software.
Any domain controller can also allow storage and management of information, provide both the needed authorization and authentication mechanisms, establishing the needed framework in order to deploy other related services, such as the Certificate Services, the Lightweight Directory Services, the Rights Management Services and the Federated Services.
Any Active Directory instance is known to be a directory service that is consisting of a corresponding executable code being responsible for maintaining the database and servicing requests as well as the database itself. The executable part which is known to be called as the “Directory System Agent” is what a collection of Windows processes and services can be called, running on Windows 2000 and later versions.
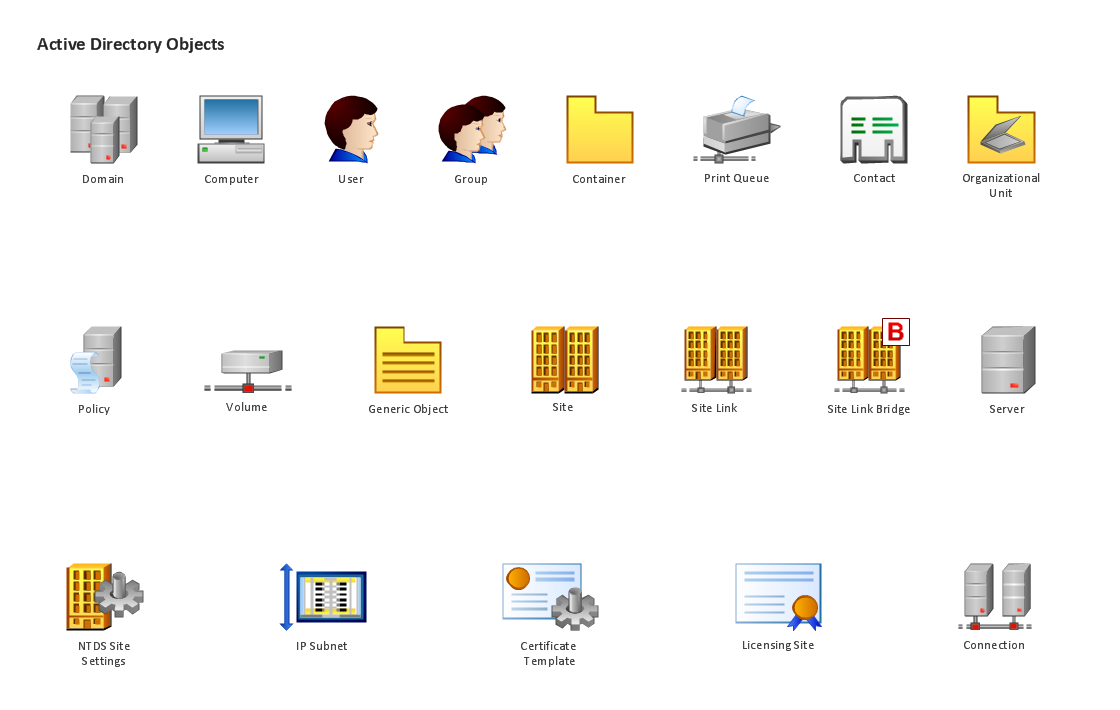
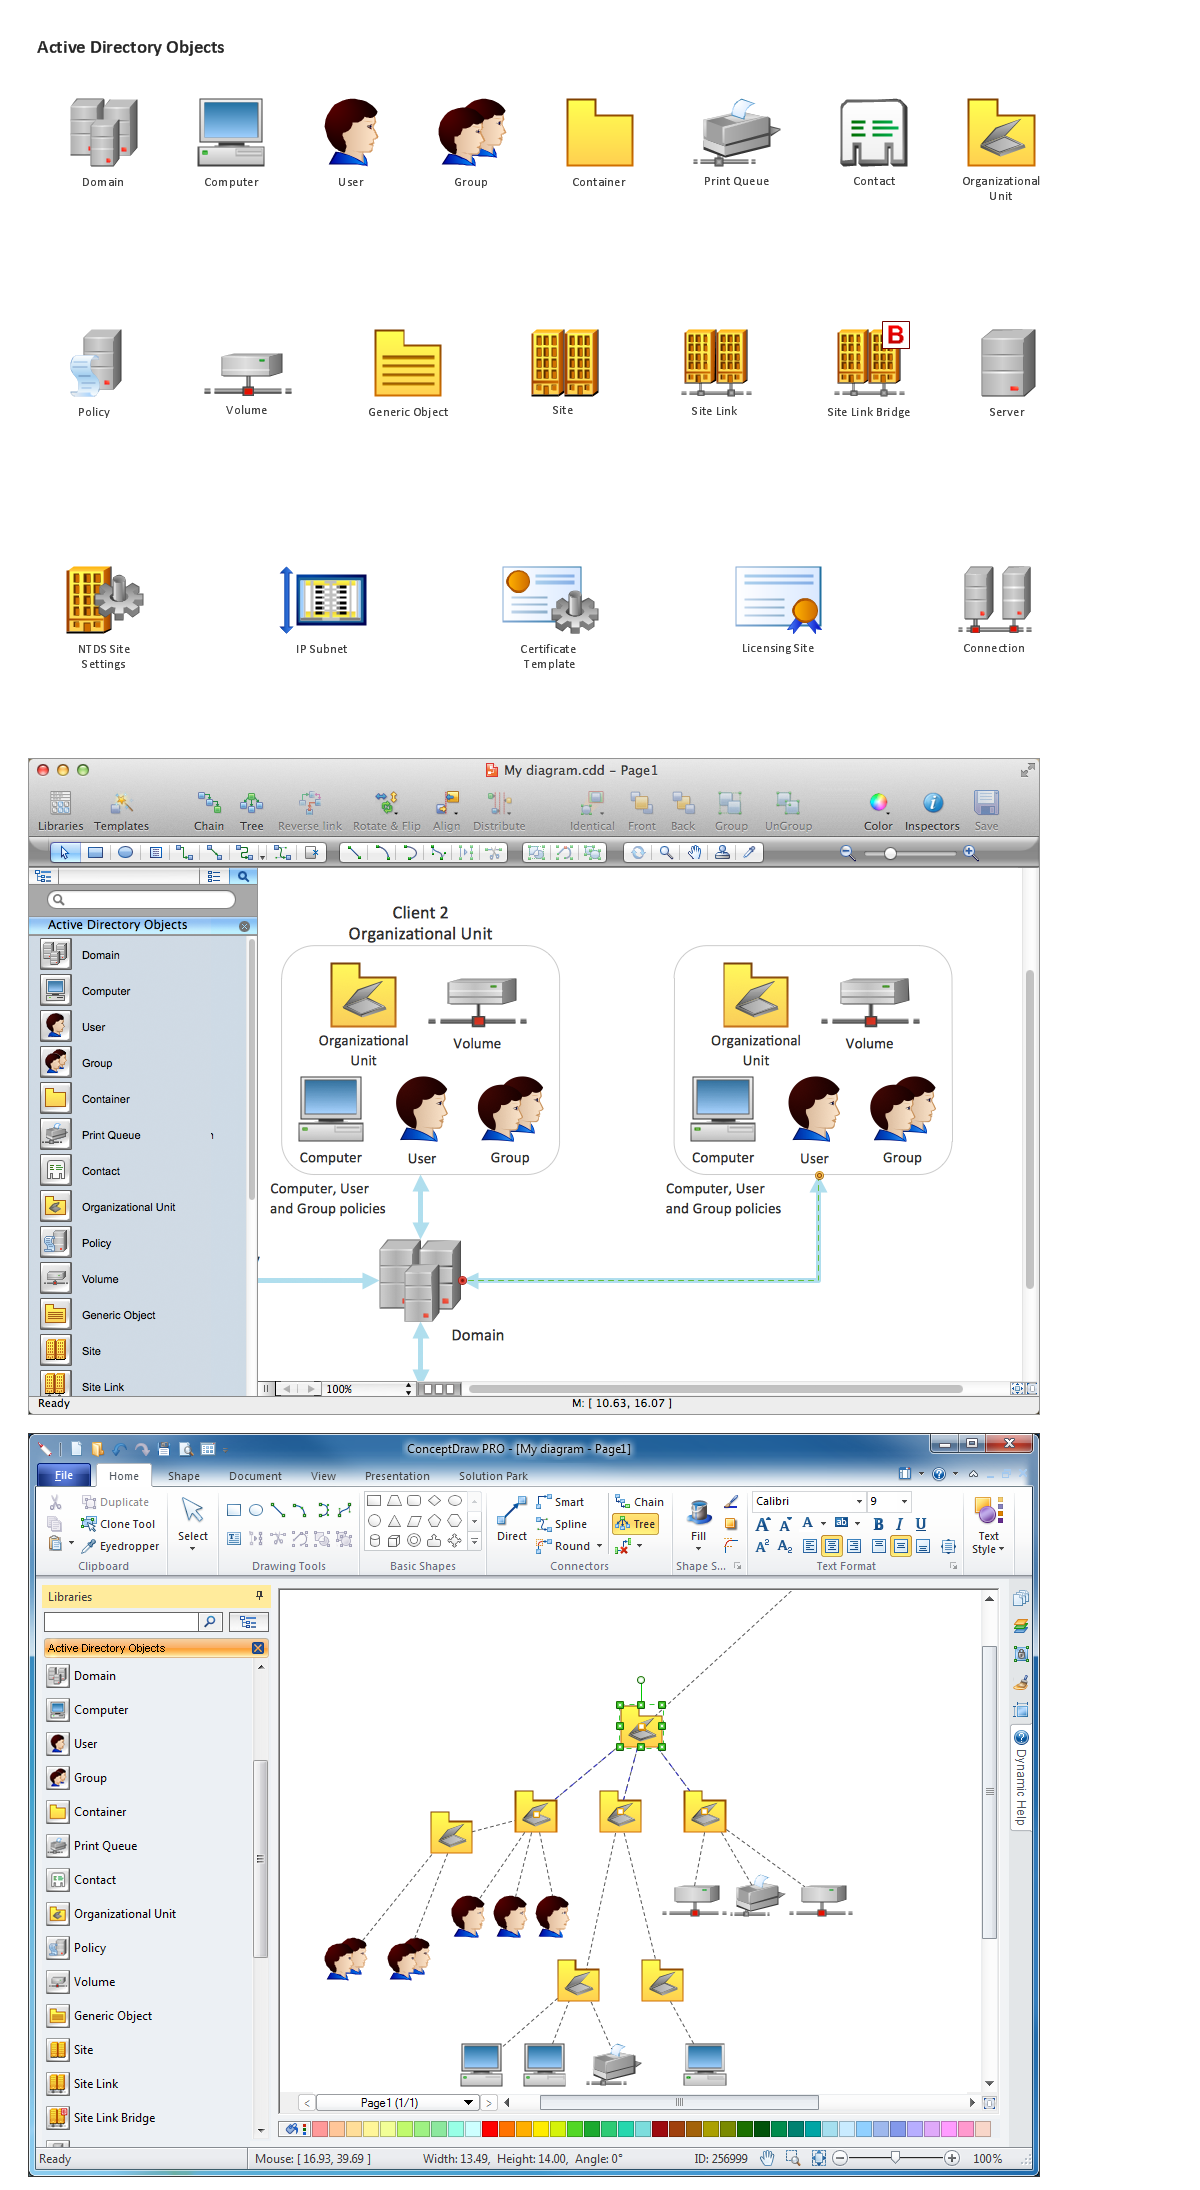
Objects that are used within the Active Directory databases can be accessed via ADSI, LDAP, Security Accounts Manager and messaging API services. Each of the objects is known to be representing some particular entity (e.g., a user, a printer, a group, a computer, etc.) as well as its attributes.
There are a few objects that can contain other ones and any object can be uniquely identified by its name, having a set of attributes (the information and the characteristics that those objects represent) that can be defined by some particular schema that determines the kinds of the objects that can be stored in Active Directory.
The mentioned “schema object” is what lets the administrators to either modify or extend the schema when it is necessary. Because of each of the schema objects is known to be integral to the definition of Active Directory objects, changing or deactivating these objects can disrupt or change any deployment fundamentally. Schema changes are known to be automatically propagating throughout the systems and being once created, any object can only be deactivated but never deleted. Any changes done to the schema can require such phase as the planning.
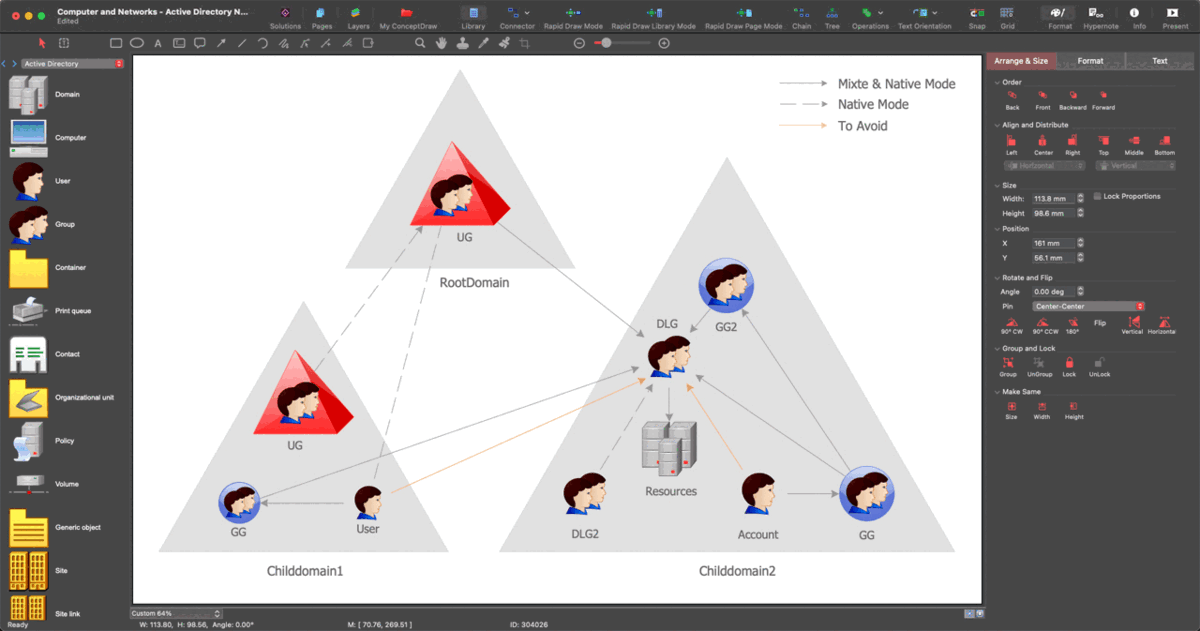
Example 2. Active Directory Network
Those objects that were held within some particular domain can be always grouped into the so-called Organizational Units which can provide the needed hierarchy to the domain, easing its administration and resembling the organization's structure in either geographical or managerial terms. Microsoft always recommends using the previously mentioned Organizational Units rather than domains for structure, simplifying the implementation of both administration and policies.
The Organizational Units is the recommended level at which the group policies may be applied and the Active Directory objects can be formally named as the “Group Policy” ones. Any domain can be defined as a logical group of such network objects as the users, the devices and the computers which share the same Active Directory database.
There are many other nuances that all have to be taken into consideration while creating the active directory networks and computer network diagrams, but even if you do not know as much about how to make the needed drawing, you can always make a smart looking one by using the pre-made examples that can be found in the Computer Network Diagrams solution.
The mentioned solution is what the team of CS Odessa developed to place in the ConceptDraw STORE application for all the ConceptDraw DIAGRAM users to get a chance to use all 364 design elements it consists. There are altogether 16 stencil libraries within the Computer Network Diagrams solution including such design symbols as the Logical ones.

Example 3. Active Directory Network Diagram in ConceptDraw DIAGRAM
Such logical design symbols include the following representations: Peer-to-peer, Coexial line tag, Fiber optic line tag, Twisted pair line tag, Cloud, Speaker, Microphone, Router, ATM router, ISON switch, ATM switch, ATM/FastGB Etherswitch, Workgroup switch, Small hub, Terminal server, Access server, Network management appliance, Bridge, SC2200 signaling controller, Security management (Cisco), Web browser, WAN, Host, Relational database, Key, Lock, Lock and key, Headquarters, Medium building (regular), Small business, House (regular), Telecommunicator house PC, Home office, Government building, University and others.
Another stencil library that is included in the Computer Network Diagrams solution is the “Computer Network” one. It includes such design symbols as the representation of the Desktop computer, HP desktop computer, Workstation, HP workstation, iMac, HP laptop, Fujitsu laptop, MacBook, MacBook Air, MacBook Pro, Computer monitor, Apple Thunderbolt Display, Mac Pro, iPad mini, iPhone 4, iPhone 5, iPhone / iPod Touch, iPod Classic, PDA, Smartphone, Mobile Phone, Mainframe, City, Satellite dish, Radio tower, Satellite, Cloud, Data store, Compact disk, Curved bus, Comm-disk, Token-ring, FDDI Ring, Star, Ethernet and bus.
See also Samples: